
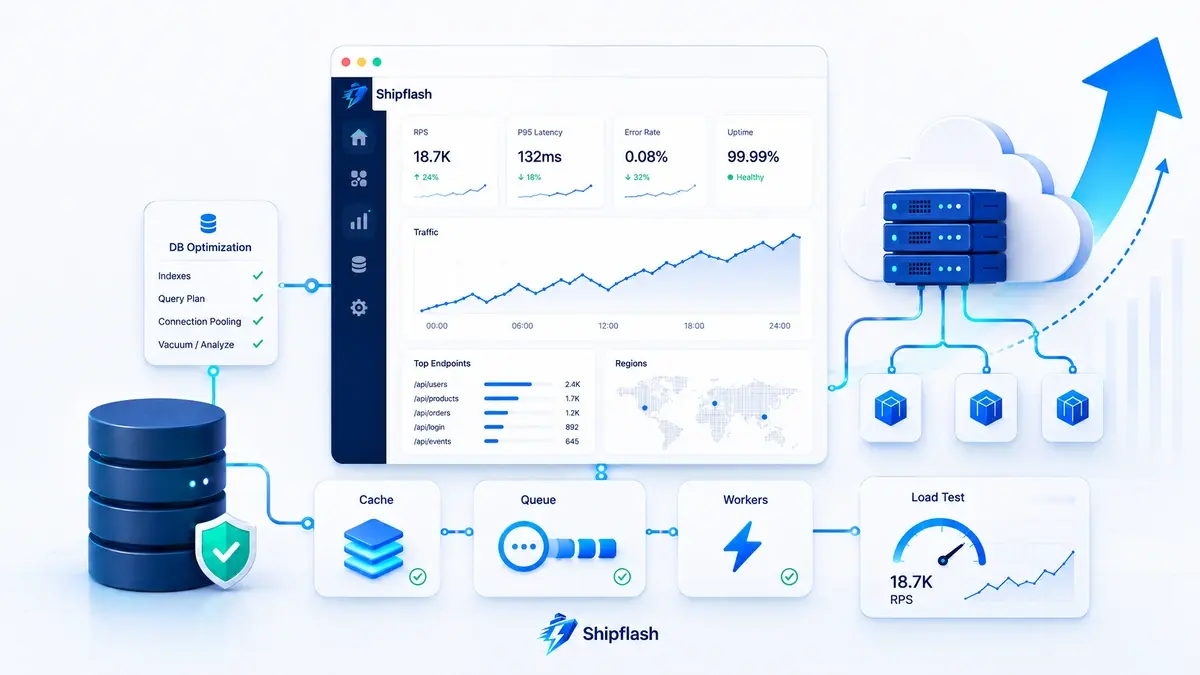
A Next.js and Supabase SaaS rarely needs a complete architectural rewrite simply because it has started attracting customers.
It usually needs something less dramatic and more disciplined: identify which part of the request path is approaching its limit, remove unnecessary work, introduce backpressure, and upgrade infrastructure only after the application is using its current resources efficiently.
For most growing SaaS products, the correct scaling sequence is:
Measure the workload, optimize database queries, control connections, cache stable data, move non-interactive work into durable queues, load-test realistic journeys, and then increase compute where the evidence shows a real resource ceiling.
Supabase already provides a dedicated Postgres instance for each hosted project, while modern Vercel Functions can scale dynamically and process concurrent invocations through Fluid compute. That does not make an application infinitely scalable, but it means the first bottleneck is often inefficient application behavior rather than an inherent limitation of Next.js or Supabase.
The difficult part is knowing what to improve first.
This guide presents a practical scaling framework for founders and developers using Next.js, Supabase, and serverless infrastructure. It focuses on the path from a newly launched product to a SaaS serving tens of thousands of active users without prematurely introducing Kubernetes, multiple databases, distributed caches, or a collection of services that the team cannot operate confidently.
Scale the bottleneck you can measure, not the architecture you fear.
What Does Scaling a Next.js and Supabase SaaS Actually Mean?
Scaling is the ability to handle more work without allowing latency, errors, operating cost, or recovery time to grow uncontrollably.
That work may come from more users, but monthly active users alone do not describe the pressure placed on your system. Two products with 50,000 monthly active users can have completely different infrastructure requirements.
A reporting tool that users open twice a month may generate less load than a collaborative application with 3,000 users editing data throughout the day. An AI product can generate substantial external API cost from a relatively small customer base. A billing webhook spike can create more concurrent database work than normal dashboard traffic.
The useful unit is therefore not simply “users.” It is work:
| Workload dimension | What it tells you |
|---|---|
| Dynamic requests per second | How much application work reaches your functions |
| Database queries per request | How much Postgres work each interaction creates |
| Query latency | How long the database remains occupied |
| Concurrent connections | How many application processes are competing for Postgres |
| Cache hit rate | How much repeat work the application avoids |
| Queue arrival and processing rates | Whether background work accumulates faster than it completes |
| External API calls | Whether email, billing, storage, or AI providers constrain throughput |
| Cost per customer workflow | Whether traffic growth remains economically sustainable |
This distinction matters because architectural changes should respond to a specific form of pressure.
A database index will not fix an overloaded email provider. A larger compute plan will not fix an N+1 query. A Redis cache will not correct unbounded background retries. Moving a function closer to the database will not help if the request performs 40 sequential queries.
A scalable application is not one that uses the most infrastructure. It is one that performs a predictable amount of bounded work for each customer action.
Establish a Performance Baseline Before Changing the Architecture
Before optimizing anything, document how the product behaves under normal traffic.
A useful baseline connects customer journeys to application and infrastructure measurements. Do not begin with isolated server metrics. Start with the actions customers actually perform:
| Customer journey | Measurements to capture |
|---|---|
| Sign in and open dashboard | End-to-end latency, auth latency, database queries, response size |
| Create or update a record | Server Action duration, transaction time, cache invalidation |
| Start checkout | Function duration, billing-provider latency, database writes |
| Process billing webhook | Verification time, event persistence, entitlement update time |
| Send transactional email | Enqueue latency, delivery attempts, provider response |
| Generate an export | Query time, memory usage, job duration, generated file size |
For each journey, record request throughput, p50 latency, p95 latency, p99 latency, error rate, database time, and external dependency time.
The percentiles matter. Averages can hide the customer experience you most need to understand. A dashboard with a 180-millisecond average can still feel unreliable if 5% of requests take four seconds. Similarly, a webhook endpoint that is usually fast may become dangerous when several events for the same subscription arrive together.
This measurement-first approach is part of a broader production-ready SaaS foundation. Scaling is substantially easier when authentication, billing, webhooks, notifications, and operational workflows already have clear boundaries instead of being scattered across unrelated route handlers.
Separate Application Latency From Database Latency
When a request is slow, divide its duration into components:
Total request duration
├── Function startup and framework work
├── Authentication and authorization
├── Database connection wait
├── Database query execution
├── External API calls
├── Serialization and response generation
└── Client network and rendering
Without this separation, teams often upgrade the wrong service.
A slow function may spend most of its time waiting for Postgres. A slow database request may actually be waiting for an available connection. A dashboard that appears database-heavy may be performing several external billing-provider requests during every page load.
Add timing around meaningful boundaries rather than logging only the total duration:
const startedAt = performance.now()

const authStartedAt = performance.now()
const user = await requireUser()
const authDurationMs = performance.now() - authStartedAt

const queryStartedAt = performance.now()
const records = await getDashboardRecords(user.id)
const queryDurationMs = performance.now() - queryStartedAt

logger.info({
  event: 'dashboard.loaded',
  requestId,
  authDurationMs,
  queryDurationMs,
  totalDurationMs: performance.now() - startedAt,
  recordCount: records.length,
})
The goal is not to log every internal function. The goal is to make the major sources of latency visible enough that an incident can be diagnosed from evidence.
Convert Monthly Users Into a Workload You Can Test
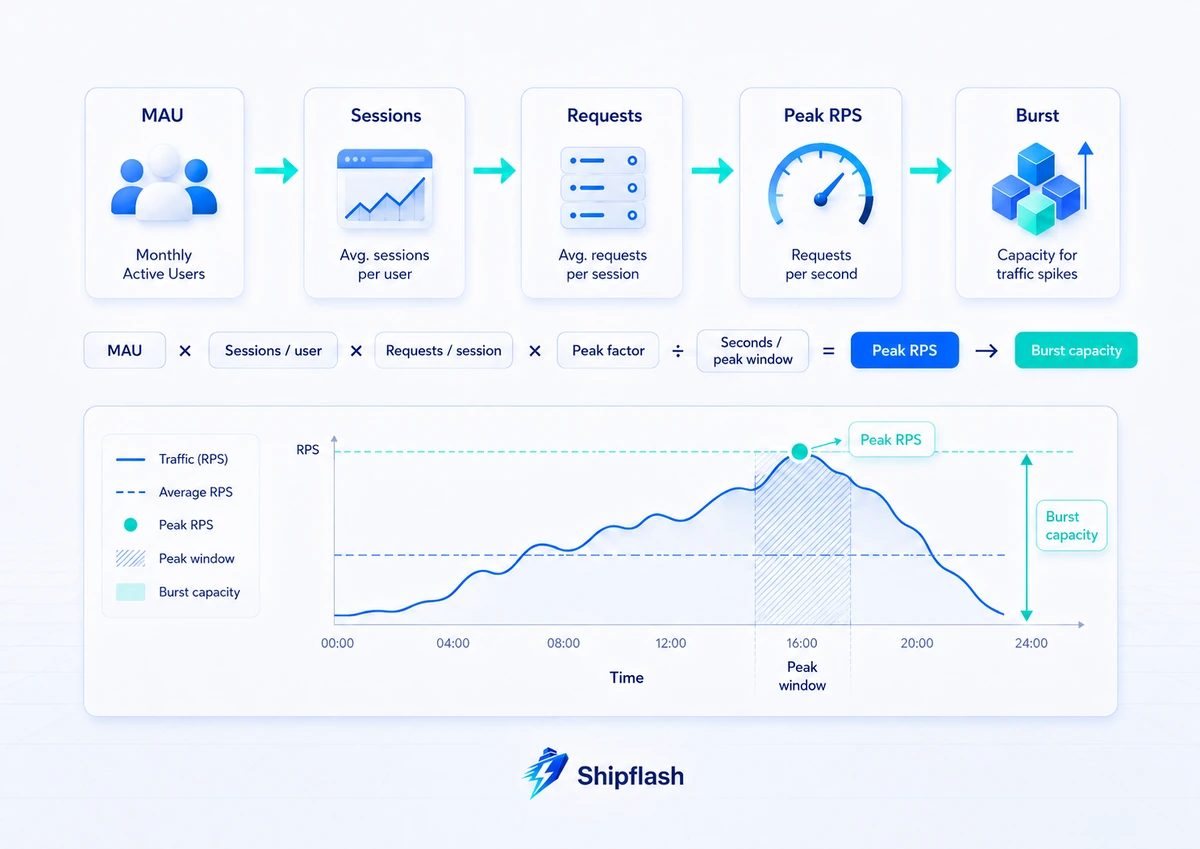
Monthly active users are useful for business reporting, but they are insufficient for capacity planning. Convert them into estimated dynamic requests and peak throughput.
A simple model is:
monthly dynamic requests =
monthly active users
× sessions per user per month
× dynamic requests per session
Then estimate the busiest period:
peak requests per second =
monthly dynamic requests
× share of traffic in the peak window
÷ peak window duration in seconds
Consider an illustrative SaaS with:
| Assumption | Example value |
|---|---|
| Monthly active users | 50,000 |
| Sessions per active user per month | 8 |
| Dynamic requests per session | 12 |
| Monthly dynamic requests | 4,800,000 |
| Traffic arriving in the busiest hour | 3% |
| Estimated busiest-hour throughput | 40 requests/second |
| Three-times burst target | 120 requests/second |
The calculations are:
50,000 × 8 × 12 = 4,800,000 dynamic requests per month

4,800,000 × 0.03 ÷ 3,600 = 40 peak requests per second

40 × 3 burst factor = 120 requests per second
These are not universal benchmarks. They are transparent assumptions that should be replaced with your analytics and logs.
The important conclusion is that 50,000 monthly users do not necessarily mean thousands of simultaneous requests. Conversely, a small product with frequent polling, AI generation, real-time collaboration, or webhook bursts may produce much more intensive demand.
Once you have an estimated peak rate, you can build a load test around customer behavior rather than selecting an arbitrary number of virtual users.
Scale the Database Before Adding More Application Servers
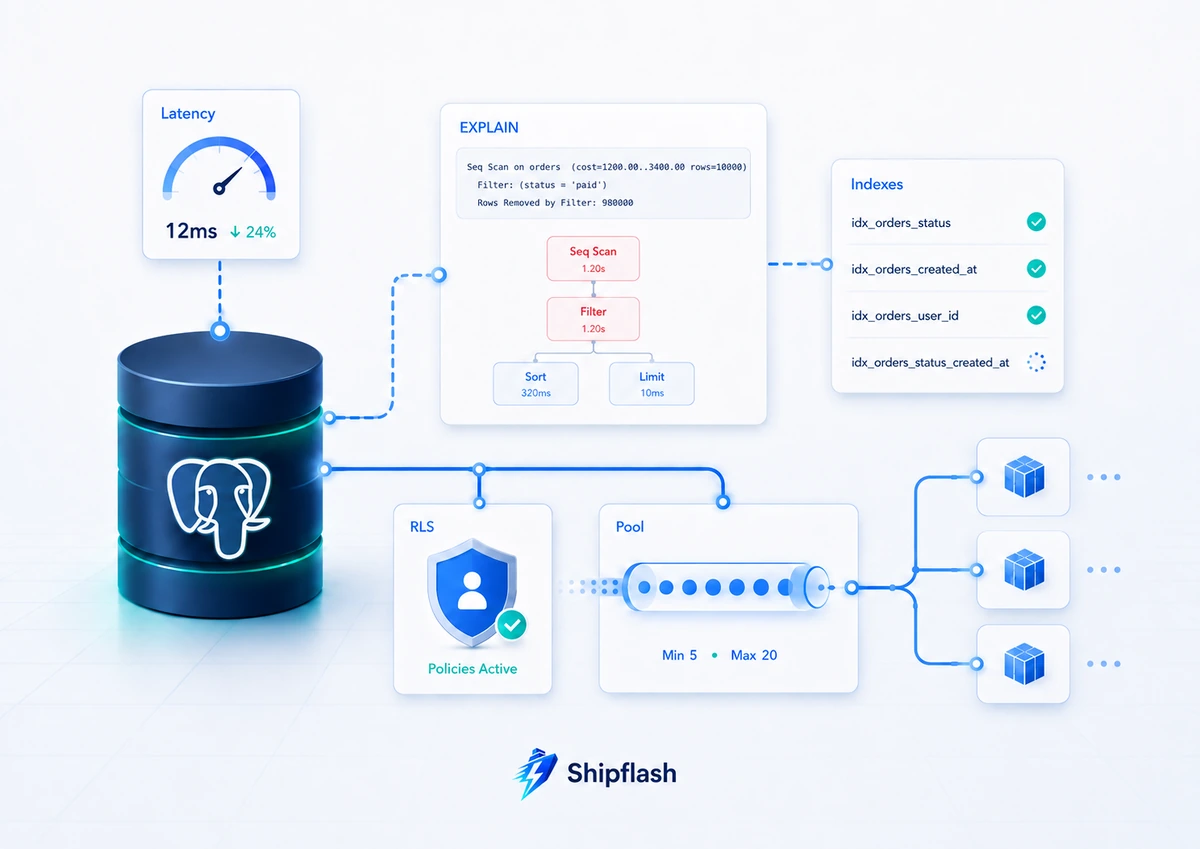
For many Next.js and Supabase products, Postgres is the first meaningful shared resource.
Serverless functions can multiply quickly during a traffic spike. The database cannot create unlimited CPU, memory, I/O, locks, or connections simply because more function instances are available. This makes database efficiency and backpressure central to the entire scaling strategy.
The best first step is not adding indexes blindly. It is finding the queries that consume the most time or resources.
Read the Query Plan, Not Just the Query
PostgreSQL creates an execution plan for every statement. The plan determines whether Postgres uses an index, scans a table, sorts rows, performs a nested loop, or chooses another execution strategy.
Use EXPLAIN to inspect the planned work and EXPLAIN ANALYZE to execute the statement and compare estimated behavior with actual behavior. PostgreSQL warns that EXPLAIN ANALYZE really runs the query, so statements with side effects must be handled carefully.
For example:
explain (analyze, buffers)
select
  id,
  status,
  created_at
from public.subscriptions
where user_id = '00000000-0000-0000-0000-000000000000'
  and status in ('active', 'trialing')
order by created_at desc
limit 20;
Pay attention to:
| Plan signal | What it may indicate |
|---|---|
| Sequential scan on a large table | Missing or unusable index |
| Large gap between estimated and actual rows | Stale statistics or unusual data distribution |
| Expensive sort | Index order does not match query order |
| Nested loop processing many rows | Join strategy or index problem |
| Rows removed by filter | Too much data is being read before filtering |
| Repeated execution of a subplan | Correlated query or inefficient policy |
| High buffer reads | Query is touching more data than expected |
Supabase’s query-optimization documentation recommends aligning indexes with the columns used for filtering, joining, and ordering. It also emphasizes that indexes have a write cost, so adding an index without confirming the query pattern can make inserts and updates more expensive without improving meaningful traffic.
Design Indexes Around Complete Query Patterns
Suppose the application repeatedly retrieves the most recent active subscriptions for a user:
select
  id,
  status,
  created_at
from public.subscriptions
where user_id = $1
  and status in ('active', 'trialing')
order by created_at desc
limit 20;
An index that follows the filtering and ordering pattern may help:
create index subscriptions_user_status_created_idx
on public.subscriptions (
  user_id,
  status,
  created_at desc
);
This does not mean every WHERE column needs its own index. The order of columns matters, as do the number of distinct values, the proportion of rows returned, the sort requirement, and the write frequency.
A status column with only three possible values may provide little value as a standalone index. The same column may be useful when combined with a user or account identifier that narrows the result first.
Partial indexes can also reduce index size when the application consistently queries a small subset:
create index subscriptions_current_user_created_idx
on public.subscriptions (
  user_id,
  created_at desc
)
where status in ('active', 'trialing');
Always test the query plan before and after the change. An index existing does not guarantee that Postgres will use it.
Index creation on a large production table can also create operational risk. Review lock behavior, deployment sequencing, and rollback before applying it. Shipflash’s Supabase database migration workflow explains how to review and deploy structural changes without treating production as an interactive SQL playground.
Optimize Row Level Security Without Weakening It
Row Level Security is part of the query plan. Every policy adds authorization conditions that Postgres must evaluate, which means policy structure can materially affect performance.
Do not respond by removing RLS from exposed tables. Optimize the policy and the query instead.
Supabase recommends indexing columns referenced by policies, wrapping stable authorization helpers such as auth.uid() in a SELECT, targeting policies to explicit roles, and including user-visible filters in the application query even when RLS already enforces the same boundary. These patterns allow the planner to avoid evaluating unnecessary rows while preserving database-level authorization.
For example:
create index documents_user_id_idx
on public.documents (user_id);

create policy "Users can read their documents"
on public.documents
for select
to authenticated
using ((select auth.uid()) = user_id);
The corresponding application query should still express the user boundary:
const { data, error } = await supabase
  .from('documents')
  .select('id, title, updated_at')
  .eq('user_id', user.id)
  .order('updated_at', { ascending: false })
  .limit(30)
The filter is not a replacement for RLS. It gives Postgres more information for planning while RLS remains the final access-control boundary.
Avoid Unbounded Reads and Expensive Counts
Queries that work with a few hundred records often become unstable when the same table holds millions.
Common examples include loading every notification, selecting complete JSON payloads when the page needs three fields, using large offset pagination, and recalculating exact totals during every request.
Prefer bounded queries:
const pageSize = 30

const { data } = await supabase
  .from('notifications')
  .select('id, title, status, created_at')
  .eq('user_id', user.id)
  .lt('created_at', cursor)
  .order('created_at', { ascending: false })
  .limit(pageSize)
Cursor-based pagination is usually more stable than requesting progressively larger offsets because the database can continue from an indexed value rather than repeatedly walking past all earlier rows.
For dashboard totals, decide whether the number must be exact and current. An operational counter may need transactionally accurate data. A marketing metric may tolerate a cached aggregate updated periodically. These are different consistency requirements and should not share an accidental implementation.
Control Database Connections in a Serverless Environment
A serverless platform can create many application instances in response to traffic. Each instance opening several direct Postgres connections can overwhelm the database before CPU usage appears high.
Supabase provides connection-pooling options specifically for this problem. Its server-side poolers share a smaller number of active Postgres connections across more clients and are recommended for auto-scaling systems such as serverless and edge functions.
However, the correct connection strategy depends on how the application accesses Supabase.
| Access path | Connection consideration |
|---|---|
| supabase-js through the Data API | Your application is not opening a raw Postgres connection for every request |
| ORM or PostgreSQL driver in serverless functions | Use an appropriate Supabase pooler rather than uncontrolled direct connections |
| Persistent Node.js server or worker | An application-side pool can be appropriate, but its maximum must remain bounded |
| Migrations and administrative tools | A direct or session-capable connection may be required depending on the operation |
This distinction prevents a common mistake: adding a Postgres connection pool to code that already communicates through the Supabase Data API, or using a direct connection string from an auto-scaling function without considering the number of instances that may appear.
Calculate the Worst-Case Connection Demand
For a direct PostgreSQL client, think in terms of total possible connections:
maximum potential application connections =
maximum concurrent application instances
× maximum connections per instance
A pool size that looks small inside one function can become large when multiplied across many instances.
The database also needs connections for Supabase services, administration, migrations, monitoring, and maintenance. Your application should not plan to consume every available slot.
Monitor connection usage and connection wait time. If requests spend time waiting for a connection, increasing function concurrency may worsen the problem. The database needs less simultaneous work, shorter queries, better pooling, or more compute—not simply more application instances.
Run Compute Near the Database
Every dynamic request that crosses regions pays network latency before Postgres starts executing the query. A page that performs multiple sequential database calls pays that cost repeatedly.
Vercel recommends placing functions close to their data source, and its Functions documentation explains that region selection should account for database locality.
The best region is therefore not always the region closest to the end user. Static assets can be delivered from a CDN close to users, while the dynamic function often belongs near the primary database.
Before introducing a read replica or multi-region data architecture, remove sequential query waterfalls:
// Slower: independent work is performed sequentially
const profile = await getProfile(userId)
const subscription = await getSubscription(userId)
const notifications = await getNotifications(userId)

// Better when the operations are independent
const [profile, subscription, notifications] = await Promise.all([
  getProfile(userId),
  getSubscription(userId),
  getNotifications(userId),
])
Parallel execution reduces request time, but it also increases simultaneous database pressure. Use it for genuinely independent bounded queries, not as a way to launch dozens of queries at once.
Cache Stable Data, Not Authorization Mistakes
Caching can remove repeated database and external-provider work, but an incorrect cache can serve stale private data, outdated entitlements, or information belonging to another customer.
The first decision is not which cache product to install. It is which data is safe to reuse.
| Data type | Typical caching approach |
|---|---|
| Public blog posts and documentation | Shared cache with event-driven invalidation |
| Public pricing and product catalog | Shared cache, invalidated after catalog changes |
| Expensive aggregate analytics | Short-lived or precomputed cache |
| User dashboard records | Usually query directly or use carefully keyed private caching |
| Current authorization and entitlements | Prefer authoritative evaluation over long-lived shared caching |
| Webhook idempotency state | Persistent database uniqueness, not an in-memory cache |
| Distributed locks and job leases | Durable shared storage, not process memory |
Next.js 16 provides Cache Components through the use cache directive, with cache lifetimes and tags for targeted invalidation. Its current documentation recommends tag-based revalidation when data changes instead of expiring everything indiscriminately.
A public billing catalog could be cached like this:
import { cacheLife, cacheTag } from 'next/cache'

export async function getPublicBillingPlans() {
  'use cache'

  cacheLife('hours')
  cacheTag('billing-plans')

  return loadPublicBillingPlans()
}
After an authorized catalog mutation:
'use server'

import { revalidateTag } from 'next/cache'

export async function updateBillingPlan(input: UpdateBillingPlanInput) {
  await requireBillingAdministrator()
  await saveBillingPlan(input)

  revalidateTag('billing-plans', 'max')
}
The exact cache lifetime should follow the cost of staleness.
A blog post being stale for several minutes may be acceptable. A customer retaining paid access after a refund, or losing access immediately after a successful renewal, is a different class of problem. Billing state should use authoritative local records and carefully designed reconciliation rather than depending on a long-lived presentation cache.
The Shipflash SaaS billing architecture guide explains why checkout, provider state, local billing records, entitlements, event history, and reconciliation must be treated as separate responsibilities.
Do Not Use Process Memory as a Correctness Boundary
Modern serverless environments may reuse a process, run multiple requests concurrently inside an instance, or create several instances for the same function. Vercel’s Fluid compute documentation explicitly notes that invocations can share a physical instance and global process while the platform still scales across additional instances when necessary.
An in-memory map may be useful as a best-effort optimization, but it is not reliable for:
| Unsafe responsibility | Why memory is insufficient |
|---|---|
| Webhook deduplication | Another instance may receive the duplicate |
| Rate-limit enforcement | Counters are not shared across instances |
| Job ownership | A process can terminate or another worker can compete |
| Billing entitlement state | Memory can be stale or lost |
| Cache invalidation guarantees | Other instances may retain old values |
Use database uniqueness constraints, durable queue semantics, or another shared store when correctness depends on all instances agreeing.
Move Non-Interactive Work Out of the Request Path
A request should complete the work required to return a truthful result to the customer. It should not remain open for every follow-up activity the action might trigger.
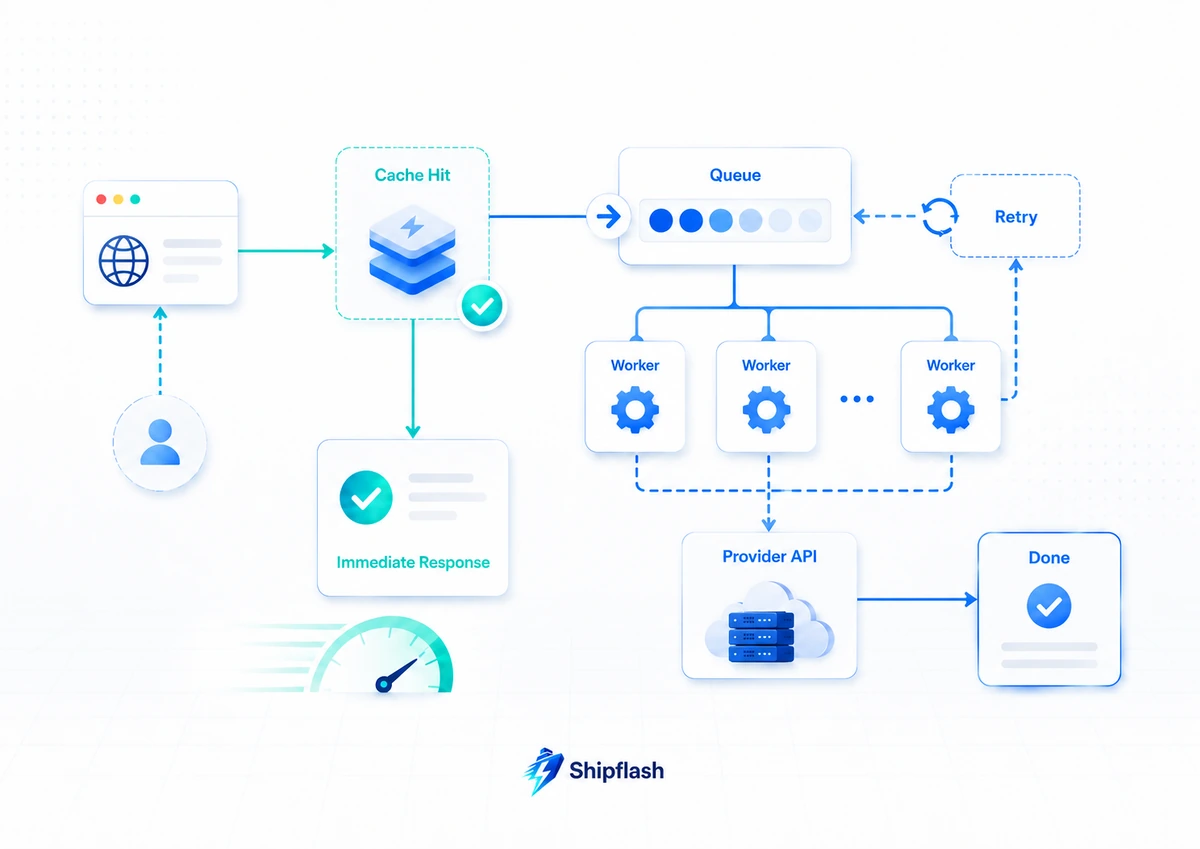
Consider a new subscription webhook. The endpoint may need to verify the signature, persist the provider event, update local billing state, apply entitlements, and record enough durable information to recover. It does not necessarily need to send a welcome email, refresh analytics, generate an invoice export, notify an internal Slack channel, and clean historical data before acknowledging the provider.
Moving secondary work into a queue reduces request duration and allows retries to happen independently.
Supabase Queues provides a Postgres-native durable message queue built on pgmq, with persisted messages, delivery controls, visibility windows, authorization options, and dashboard management.
A useful division looks like this:
| Keep in the request or transaction | Move to a queue |
|---|---|
| Validate input and authorization | Send transactional follow-up email |
| Verify webhook signature | Refresh non-critical analytics |
| Persist the source event | Generate a large export |
| Apply customer-visible state required for the response | Synchronize secondary systems |
| Create a durable outbox or queue record | Retry a rate-limited external provider |
| Return a truthful success or failure result | Perform retention and cleanup work |
The queue does not remove the need for correctness. It changes where correctness is enforced.
Every queued job should have a stable identity, bounded attempts, retry policy, processing timeout, and terminal state. The handler must also be safe when the same work is delivered more than once.
For example:
create table public.background_jobs (
  id uuid primary key default gen_random_uuid(),
  job_key text not null unique,
  job_type text not null,
  payload jsonb not null,
  status text not null default 'pending',
  attempts integer not null default 0,
  available_at timestamptz not null default now(),
  locked_at timestamptz,
  locked_by text,
  last_error text,
  completed_at timestamptz,
  created_at timestamptz not null default now()
);
The unique job_key provides an idempotency boundary:
insert into public.background_jobs (
  job_key,
  job_type,
  payload
)
values (
  'subscription-welcome:sub_123',
  'subscription_welcome',
  '{"subscriptionId":"sub_123"}'::jsonb
)
on conflict (job_key) do nothing;
This prevents a duplicate webhook or retried request from creating the same logical job repeatedly.
Shipflash’s guide to queues, cron jobs, and retries for Next.js SaaS covers visibility timeouts, leases, backoff, replay, dead-letter handling, and the differences between scheduled triggers and durable execution.
Add Backpressure Before Increasing Worker Concurrency
When a queue grows, the immediate reaction is often to add workers. That is safe only when the downstream system has additional capacity.
If each worker performs database writes, increasing worker concurrency can overload Postgres. If each job calls an email or billing API, more workers can exceed provider rate limits. If jobs are expensive, aggressive concurrency can turn a temporary backlog into a cost incident.
Backpressure means limiting consumption to a rate the dependency can sustain.
A worker should therefore define:
| Control | Purpose |
|---|---|
| Batch size | Limits how much work is claimed at once |
| Worker concurrency | Bounds simultaneous processing |
| Visibility or lease duration | Allows abandoned work to become available again |
| Exponential backoff | Prevents rapid repeated failure |
| Maximum attempts | Stops permanent failures from retrying forever |
| Dead-letter or failed state | Keeps exhausted work available for investigation |
| Provider-specific limit | Protects external API quotas |
| Queue-depth alert | Detects when arrival rate exceeds processing rate |
A backlog is not automatically an emergency. A backlog with an increasing oldest-job age, missed business deadline, or exhausted retry capacity is.
Understand Serverless Concurrency Before Raising Limits
Application concurrency and database capacity are connected.
Vercel Functions scale automatically with demand, while Fluid compute can process multiple invocations inside an existing function instance before creating more instances. This improves infrastructure efficiency, especially for I/O-bound workloads, but it also means code must be safe under concurrent execution.
Do not assume that module-level mutable state belongs to one request:
// Unsafe: concurrent requests may modify shared state
let currentUserId: string | null = null

export async function GET(request: Request) {
  currentUserId = await resolveUserId(request)
  return Response.json({ currentUserId })
}
Request-specific state must remain local:
export async function GET(request: Request) {
  const currentUserId = await resolveUserId(request)
  return Response.json({ currentUserId })
}
The same principle applies to temporary authorization context, mutable configuration, request metadata, and transaction state.
Concurrency should also be bounded at dependency boundaries. Ten concurrent requests that each create ten simultaneous database queries can generate 100 active queries. Improving application concurrency without controlling downstream fan-out can reduce performance instead of increasing it.
Load-Test Customer Workflows, Not Just the Homepage
Load testing should answer a decision question:
“Can the system complete its important customer workflows at the expected peak rate while meeting its latency and error objectives?”
A homepage benchmark does not answer whether authenticated dashboards, writes, webhooks, exports, or queued work remain stable.
Grafana k6 supports workload scenarios and performance thresholds that can turn service-level objectives into automated pass-or-fail criteria. Its documentation recommends using thresholds for conditions such as maximum error rates and latency percentiles.
A basic authenticated API test might look like this:
import http from 'k6/http'
import { check, sleep } from 'k6'

export const options = {
  scenarios: {
    dashboard_load: {
      executor: 'ramping-arrival-rate',
      startRate: 5,
      timeUnit: '1s',
      preAllocatedVUs: 20,
      maxVUs: 200,
      stages: [
        { target: 20, duration: '2m' },
        { target: 50, duration: '5m' },
        { target: 100, duration: '2m' },
        { target: 0, duration: '1m' },
      ],
    },
  },
  thresholds: {
    http_req_failed: ['rate<0.01'],
    http_req_duration: ['p(95)<500', 'p(99)<1000'],
  },
}

export default function () {
  const response = http.get(
    `${__ENV.BASE_URL}/api/dashboard/summary`,
    {
      headers: {
        Authorization: `Bearer ${__ENV.TEST_ACCESS_TOKEN}`,
      },
      tags: {
        journey: 'dashboard-summary',
      },
    },
  )

  check(response, {
    'dashboard returned 200': (result) => result.status === 200,
  })

  sleep(1)
}
The latency thresholds above are examples, not universal targets. Your threshold should reflect the workflow and customer expectation.
A cached public page can have a much stricter target than a complex export request. A webhook may prioritize a low failure rate and bounded acknowledgement time. A background job may prioritize completion within a business deadline rather than an interactive response time.
Use Several Test Shapes
A useful performance test program includes different traffic patterns:
| Test | Question it answers |
|---|---|
| Smoke test | Does the script work, and does the system behave correctly at minimal load? |
| Average-load test | Can normal traffic meet latency and error targets? |
| Stress test | At what point does the system stop meeting its objectives? |
| Spike test | Can the system absorb a sudden traffic or webhook burst? |
| Soak test | Do connections, memory, queues, or costs degrade over time? |
Grafana’s k6 testing guidance distinguishes these test types because each exposes different failure modes. A five-minute load test may miss connection leakage, growing job backlogs, cache churn, or accumulated database contention that appears during a longer run.
Use Realistic Data Distribution
A test database containing 100 evenly distributed rows will not reveal the behavior of a production table containing millions of records.
Performance is influenced by:
| Data characteristic | Possible effect |
|---|---|
| Large customer with far more records than average | Slow dashboard and policy evaluation |
| Many rows sharing one status | Index selectivity differs from development |
| Old records accumulated over time | Larger indexes and slower maintenance |
| Large JSON or text payloads | Higher I/O and response serialization |
| Uneven billing-event history | Hot accounts and lock contention |
| Deleted or updated rows | Table and index bloat |
Seed realistic large accounts, inactive records, failed jobs, duplicate webhook attempts, and varied timestamps. Test both common customers and worst-case customers.
Do not load-test a production environment casually. Use an isolated environment that resembles production closely enough to produce useful results, and coordinate any production validation so it cannot harm customers, trigger real emails, create real charges, or overwhelm external providers.
A Practical Scaling Framework From 1,000 to 50,000 Monthly Users
No fixed number of users determines when a SaaS needs a queue, cache, database upgrade, or architectural rewrite. The table below is a decision framework, not a capacity guarantee.
| Growth stage | Primary objective | Typical engineering focus |
|---|---|---|
| Around 1,000 MAU | Establish trustworthy behavior | Request IDs, query timing, bounded reads, error tracking, basic indexes |
| Around 5,000 MAU | Remove obvious repeated work | Query-plan review, connection strategy, shared caching for public data |
| Around 10,000 MAU | Separate interactive and asynchronous work | Durable queues, idempotency, retry policies, realistic load tests |
| Around 25,000 MAU | Control peaks and operational cost | Backpressure, queue-age alerts, p95/p99 SLOs, cost per workflow |
| Around 50,000 MAU | Scale verified resource constraints | Compute upgrades, advanced read models, partitioning or infrastructure changes only where measurements justify them |
A product may need the “50,000 MAU” techniques at 2,000 users if every request performs expensive AI processing. Another may remain comfortable with simple infrastructure beyond 50,000 users because most content is static and customer activity is infrequent.
The stages are useful because they define the maturity of the operating model rather than promising that a particular plan supports an exact number of customers.
Know When a Compute Upgrade Is Actually Justified
Infrastructure upgrades are valid scaling tools. They should simply come after avoidable work has been removed.
Supabase compute sizes provide different CPU, memory, connection, and recommended database-size characteristics. Supabase also notes that application performance depends on multiple factors beyond database size, including the workload and resources available to the project.
A database compute upgrade is easier to justify when:
| Evidence | Interpretation |
|---|---|
| CPU remains saturated during legitimate traffic | Queries need more processing capacity after optimization |
| Memory pressure causes poor cache behavior | The working set does not fit comfortably |
| Connection demand is legitimate and well pooled | The workload needs more database capacity |
| I/O remains constrained after query and index improvements | The application is reading or writing substantial necessary data |
| Query latency rises predictably with traffic | The resource ceiling has been reproduced |
| Load tests fail at the expected peak after software improvements | Additional capacity has a measurable purpose |
An upgrade is harder to justify when the application still has unbounded queries, missing indexes, repeated provider calls, connection leaks, or synchronous work that belongs in a queue.
The same principle applies to Vercel compute. More duration, memory, or concurrency cannot make an inefficient request economically sustainable if each customer action performs unnecessary work.
Track the effect of every upgrade. A larger plan should improve a defined measurement, such as p95 database latency, queue processing rate, or successful peak throughput. If the measurement does not improve, the assumed bottleneck was probably incorrect.
Common Scaling Mistakes in Next.js and Supabase Applications
| Mistake | Why it fails | Better approach |
|---|---|---|
| Treating MAU as a capacity metric | It ignores frequency, bursts, and work per request | Convert usage into peak request and job rates |
| Indexing every filter column | Indexes increase write and storage costs | Design indexes around measured query patterns |
| Removing RLS for speed | It trades performance problems for security problems | Optimize policies, filters, and policy indexes |
| Caching current authorization state broadly | Stale access decisions can affect customer security or billing | Keep access checks authoritative and invalidate carefully |
| Increasing worker concurrency immediately | Downstream systems may become more overloaded | Add backpressure and raise concurrency gradually |
| Using memory for idempotency or locks | Instances do not share one reliable process | Use database constraints or durable shared storage |
| Load-testing only public pages | It misses database, auth, billing, and write pressure | Test complete customer journeys |
| Upgrading infrastructure before measuring | The cost rises without proving the bottleneck | Baseline, reproduce, change one layer, and compare |
| Splitting into microservices too early | Operational complexity grows before it solves a measured problem | Preserve clear module boundaries inside a simpler deployment |
| Ignoring cost while optimizing latency | A fast workflow can still be economically unsustainable | Track infrastructure and provider cost per workflow |
Scaling mistakes usually begin with a correct concern but an unsupported solution.
The founder sees a slow dashboard and assumes Supabase is the problem. The developer sees serverless concurrency and assumes a larger connection pool is required. The team sees a queue backlog and doubles the workers without checking whether the email provider is returning rate-limit responses.
The solution is not to avoid architectural change. It is to make each change answer a specific measured constraint.
A Production Scaling Review Checklist
Before introducing another service or upgrading infrastructure, review the application in this order:
| Area | Evidence required |
|---|---|
| Workload | Peak dynamic requests, database queries, jobs, and provider calls are estimated |
| Customer journeys | Important workflows have p50, p95, p99, and error-rate measurements |
| Database | Slow queries have plans, indexes are justified, and reads are bounded |
| RLS | Policy columns are indexed and policies remain secure |
| Connections | Access paths and pooler choices are documented |
| Regions | Dynamic compute is located appropriately relative to the database |
| Caching | Cacheable data, keys, lifetimes, and invalidation events are defined |
| Background work | Jobs are durable, idempotent, bounded, retriable, and observable |
| Concurrency | Database and provider fan-out remain within safe limits |
| Load testing | Expected peaks and bursts have automated pass-or-fail thresholds |
| Cost | Expensive workflows have measurable per-operation cost |
| Recovery | Failed jobs, webhook events, and deployments can be replayed or repaired |
This review complements a broader Next.js SaaS production checklist. A launch checklist asks whether the system is safe to release. A scaling review asks whether its behavior remains controlled as the workload grows.
When Should You Move Beyond Next.js and Supabase?
Changing the architecture becomes reasonable when the existing design creates a demonstrated constraint that cannot be removed economically.
Examples include a workload requiring specialized long-running compute, independent scaling for a high-volume processing component, strict data-residency requirements, advanced analytical workloads that should not compete with transactional queries, or operational requirements that no longer fit the managed platform.
Even then, migration does not have to mean rewriting the whole product.
A modular SaaS can extract one workload at a time:
Next.js application
├── Authentication and customer-facing UI
├── Transactional Supabase database
├── Billing and entitlement processing
├── Durable background worker
├── Analytics pipeline
└── Specialized high-compute service
The customer-facing application can remain on Next.js while a processing-heavy feature moves to a dedicated worker. Supabase can remain the transactional source of truth while analytical events flow to another system. A durable workflow platform can handle long-running orchestration without moving ordinary dashboard routes.
Clear boundaries make selective extraction possible. Premature microservices make every feature distributed before the product has enough traffic or engineering capacity to justify that complexity.
How Shipflash Helps You Start With Scalable Boundaries
Scaling is easier when the application already separates authentication, billing, content, customer operations, notifications, settings, and background workflows.
Shipflash provides a production-oriented Next.js and Supabase foundation with structured product modules, local billing records, webhook handling, notification operations, administrative surfaces, testing infrastructure, and an AI-readable codebase. Its purpose is not to promise unlimited scale automatically. It is to give founders and developers a cleaner starting point for measuring, extending, and operating the systems that commonly become difficult after launch.
That distinction matters.
A starter project may prove that login, checkout, and a dashboard can work. A production-minded foundation also needs to make failures visible, keep customer state recoverable, preserve authorization boundaries, and provide clear places for queues, retries, reconciliation, rate limits, and operational controls.
Explore Shipflash to start with more of that production structure already in place.
Conclusion: Scale by Reducing Uncontrolled Work
A Next.js and Supabase SaaS does not become scalable by collecting more infrastructure.
It becomes scalable when each customer action creates a known, bounded, observable amount of work.
Start by translating user activity into peak requests and background jobs. Measure complete customer journeys. Optimize Postgres query plans and RLS policies before adding database capacity. Use the correct connection path for serverless compute. Cache only data with a clear consistency model. Move secondary work into durable queues. Control concurrency at database and provider boundaries. Finally, load-test realistic workflows against explicit latency and error thresholds.
Upgrade compute when the evidence shows a real resource ceiling. Introduce specialized infrastructure when one workload has genuinely outgrown the shared architecture.
The result is not only a faster SaaS. It is a product whose behavior remains understandable when traffic rises, dependencies fail, jobs accumulate, and customers begin using the system in ways that the original prototype never experienced.