
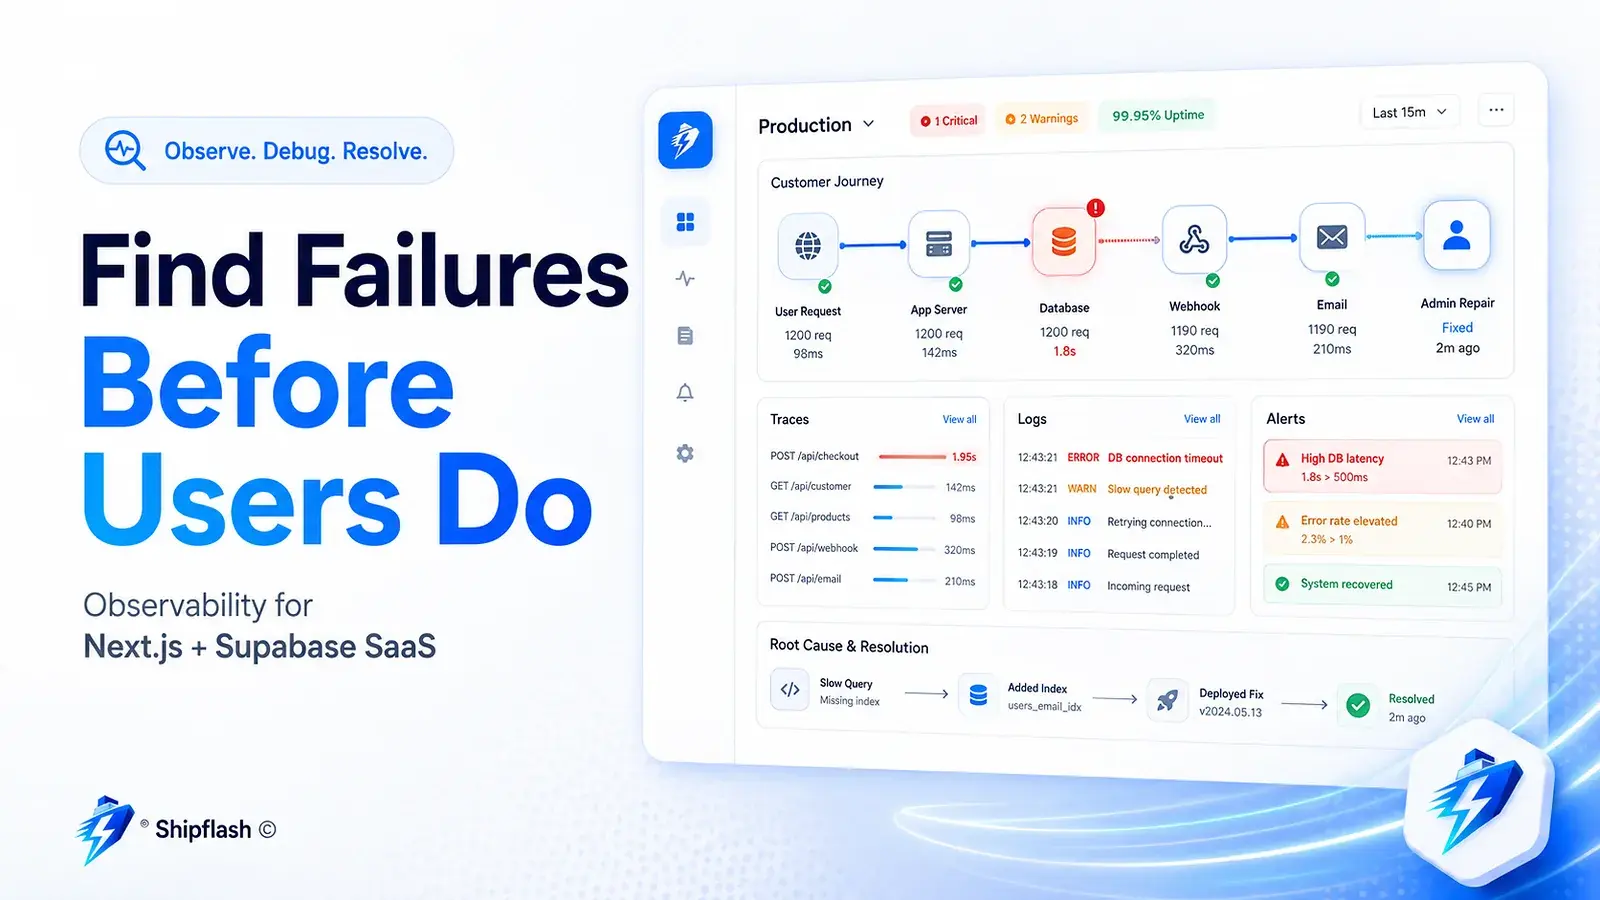
Your uptime monitor says the application is online.
Vercel reports successful deployments. Supabase is reachable. Stripe is processing payments. Resend is accepting email requests.
Yet a customer has paid and still cannot access the product.
Another customer never received a password-reset email. A scheduled cleanup job stopped running yesterday. Support knows something is wrong, but nobody can explain where the failure occurred or whether other users are affected.
That is the gap observability is supposed to close.
Observability is the ability to explain what happened to a specific customer workflow, where it failed, how many users are affected, and what can be done safely to recover it.
For a Next.js and Supabase SaaS, that requires more than collecting console logs. The application must connect incoming requests, authenticated users, database operations, payment events, email deliveries, background jobs, deployments, and operator actions into evidence that can be searched and understood.
This guide explains how to build that evidence without turning a small SaaS into an enterprise monitoring project.
What Observability Means for a SaaS Product
Monitoring and observability are related, but they solve different questions.
Monitoring tells you whether a known condition has crossed a threshold. Observability helps you investigate why an unfamiliar failure occurred.
A latency alert might tell you that an API route has become slow. An observable system lets you determine that the route is slow because a missing database index increased query time after a deployment, which caused serverless functions to remain active longer, exhausted available connections, and delayed checkout entitlement updates.
The distinction becomes clearer when the signals are compared directly.
| Signal | Primary question | Example in a SaaS |
|---|---|---|
| Logs | What event happened? | A billing webhook failed while updating an entitlement |
| Metrics | Is the behavior becoming abnormal? | The webhook failure rate increased from 0.1% to 8% |
| Traces | Where was time spent or failure introduced? | The request waited 2.4 seconds on a database call |
| Errors | What exception interrupted execution? | A unique constraint rejected a duplicate write |
| Business events | Did the customer outcome happen? | Payment completed, but access was not granted |
| Audit events | Who changed something operationally? | An administrator replayed the failed billing event |
The OpenTelemetry observability primer describes logs, metrics, and traces as complementary signals. Logs record events, metrics aggregate measurements, and traces show the path of an operation through a system. OpenTelemetry currently defines traces, metrics, logs, and baggage as its primary signal categories.
The important lesson is not that every SaaS needs every possible telemetry product. It is that no single signal can explain the entire customer experience.
A stack trace without business context cannot tell you whether a paying customer lost access. A payment event without application logs cannot explain why access was not granted. A CPU graph cannot show which workflow caused the load.
Observability becomes useful when these pieces share enough context to be connected.
Start With Customer Journeys, Not Monitoring Tools
A common implementation mistake is beginning with a vendor decision:
“Should we use Sentry, Datadog, Grafana, Vercel Observability, or another platform?”
That question comes too early.
First decide which customer journeys must never fail silently. For most SaaS products, the critical paths include account creation, authentication, checkout, access provisioning, password recovery, transactional email, subscription changes, data exports, and scheduled processing.
Each journey should have an observable success condition.
| Customer journey | Successful outcome | Failure evidence to preserve |
|---|---|---|
| Signup | Account created and verification initiated | Request ID, auth result, email enqueue result |
| Login | Valid session established | Auth error category, rate-limit result, session outcome |
| Checkout | Provider accepts the payment session | Checkout ID, customer reference, plan reference |
| Billing webhook | Local billing state and entitlements updated | Provider event ID, processing status, retry count |
| Password reset | Reset email accepted for delivery | Email message ID, template version, delivery status |
| Scheduled job | Expected work completed within its window | Job ID, lease, attempt, processed count, final status |
| Admin repair | Controlled action completed and audited | Operator, reason, target, before/after state |
This changes how you instrument the application.
Instead of logging “function completed,” you record whether the intended customer outcome happened. Instead of alerting whenever any exception appears, you alert when a critical workflow stops meeting its reliability target.
The most important signals are frequently not infrastructure signals at all. They are conditions such as:
payment_completed_without_entitlement
verification_email_pending_too_long
webhook_received_but_not_applied
scheduled_job_overdue
refund_recorded_but_access_unchanged
These conditions describe broken product promises. They are usually more actionable than “function invocation failed.”
Build an Evidence Ladder
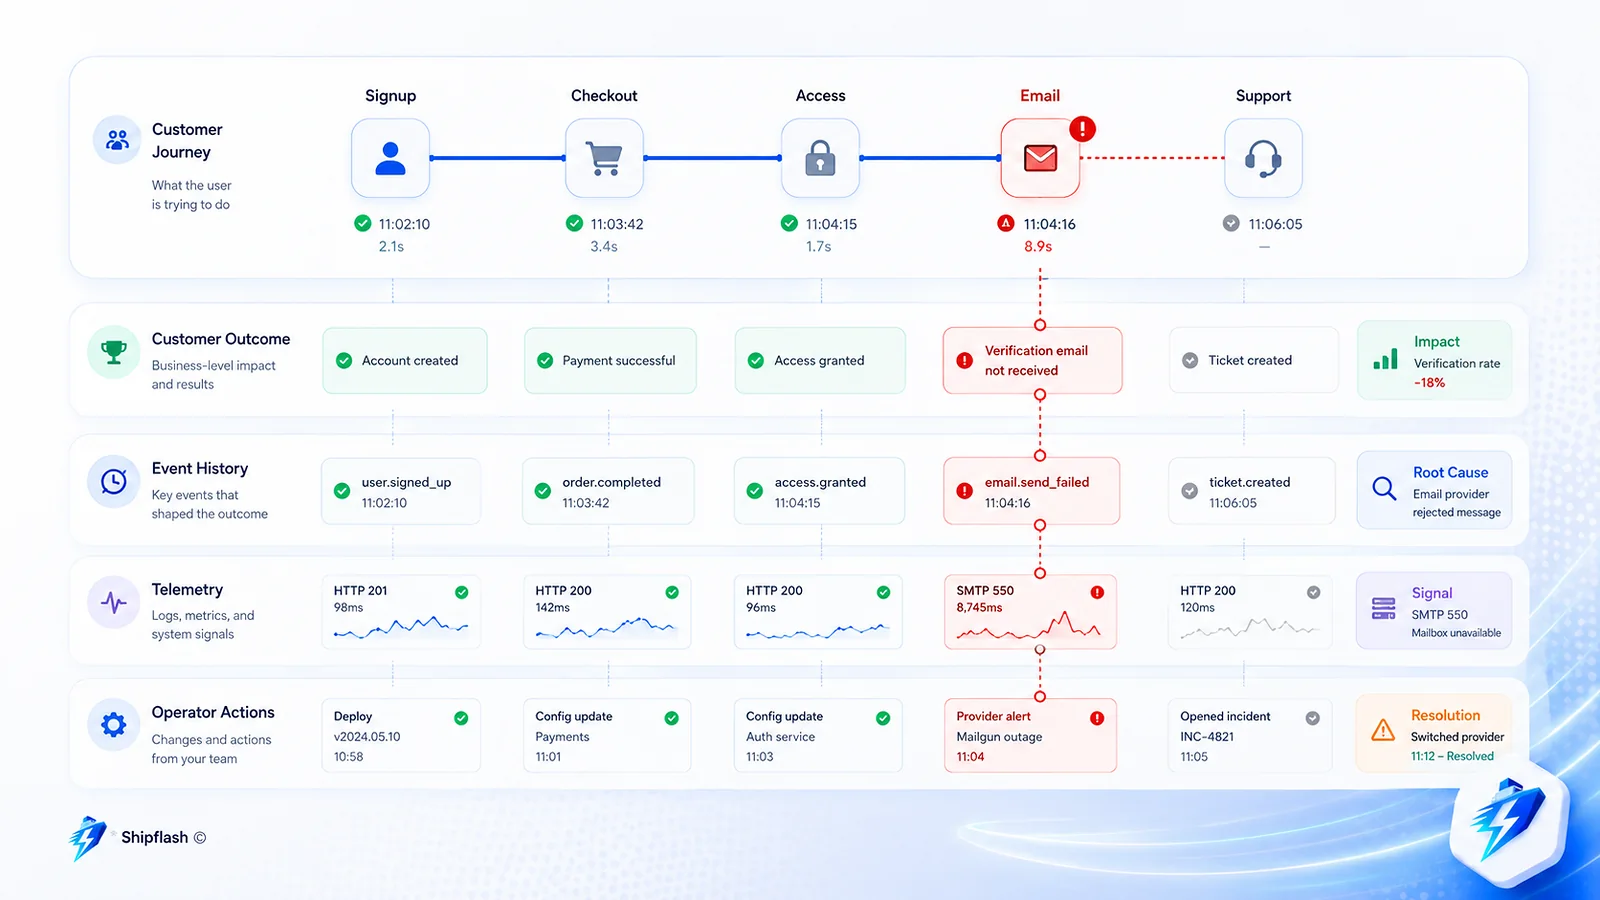
Production investigations become much faster when the system has distinct layers of evidence.
Do not treat logs as the canonical source for everything. Logs are often sampled, retained temporarily, duplicated, or stored outside the application database. They are useful for diagnosis, but they should not be the only proof that a business operation occurred.
A practical SaaS evidence model has four layers.
| Evidence layer | Purpose | Typical retention |
|---|---|---|
| Canonical business state | The product’s current truth | Long-term |
| Durable event history | How important state changed | Long-term or policy-based |
| Operational telemetry | Why execution behaved as it did | Short-to-medium term |
| Operator history | Who investigated or repaired the issue | Long-term |
For billing, the canonical state might be the customer’s current entitlement. The durable event history records which provider events were received and applied. Operational telemetry explains how long processing took and where it failed. The operator history records a manual replay or correction.
This separation matters because each data type has different requirements.
High-volume request logs may belong in a telemetry backend. Payment and webhook history usually belongs in your application database. Security-sensitive administrator actions need an audit trail. Current account access must remain queryable even after old telemetry expires.
The result is a system that remains explainable without forcing one storage mechanism to perform every role.
Design a Structured Event Contract
Human-readable log messages are useful during local development:
Something went wrong while processing billing
In production, that message is nearly useless.
It does not identify the customer, workflow, provider event, deployment, error category, retry status, or affected operation. It is also difficult to aggregate reliably because small wording changes create different messages.
Structured logs turn operational events into queryable records.
{
  "timestamp": "2026-08-04T09:14:32.418Z",
  "level": "error",
  "event": "billing.entitlement_sync.failed",
  "environment": "production",
  "release": "9db81c4",
  "request_id": "req_01K1A6R98CXQ",
  "trace_id": "63bd9547cf7aa2e48d9fb76d2cbf7231",
  "operation_id": "op_01K1A6R9A2JH",
  "actor_ref": "usr_7f29d",
  "provider": "stripe",
  "provider_event_id": "evt_123",
  "customer_ref": "cus_internal_1842",
  "outcome": "failed",
  "error_code": "entitlement_write_conflict",
  "retryable": true,
  "attempt": 2,
  "duration_ms": 842
}
A good event contract should answer several questions immediately:
| Field | Question it answers |
|---|---|
| event | What operation or state transition occurred? |
| request_id | Which incoming request started the work? |
| trace_id | Which distributed execution path contains it? |
| operation_id | Which logical workflow does this belong to? |
| actor_ref | Which authenticated actor initiated it? |
| entity_ref | Which customer, subscription, email, or job was affected? |
| outcome | Did it succeed, fail, skip, retry, or partially complete? |
| error_code | What stable failure category applies? |
| retryable | Should automated retry be attempted? |
| release | Which deployed version produced the event? |
| duration_ms | How long did the operation take? |
Event names should describe stable domain actions rather than implementation details.
billing.webhook.processing.failed is more durable than stripeRouteHandlerCatchBlockError.
The route handler may be renamed or moved. The business operation remains the same.
Keep Error Codes Stable
Raw error messages are useful diagnostic details, but they are poor dimensions for dashboards and alerts. They can contain dynamic values, provider wording, stack traces, SQL fragments, or personally identifiable information.
Define a controlled set of error codes instead:
export type BillingErrorCode =
  | "signature_invalid"
  | "event_duplicate"
  | "customer_unresolved"
  | "catalog_mapping_missing"
  | "entitlement_write_conflict"
  | "provider_unavailable"
  | "database_unavailable"
  | "unexpected_failure";
The original exception can still be captured in an error-monitoring system, but metrics and alert rules should use stable categories.
This makes it possible to ask useful questions:
How many entitlement_write_conflict failures occurred after release 9db81c4?
That is much more reliable than grouping hundreds of slightly different exception messages.
Propagate a Request ID Across the Application
A request ID connects events produced during one incoming HTTP request.
It should be created at the application boundary, added to every structured event, returned in the response, and propagated to downstream calls when appropriate.
import { randomUUID } from "node:crypto";

const REQUEST_ID_PATTERN = /^[a-zA-Z0-9._:-]{1,128}$/;

export function resolveRequestId(request: Request): string {
  const incoming = request.headers.get("x-request-id");

  if (incoming && REQUEST_ID_PATTERN.test(incoming)) {
    return incoming;
  }

  return randomUUID();
}
For public traffic, do not trust arbitrary request headers without validation. An attacker could send extremely long values, inject delimiters, or deliberately reuse identifiers to confuse an investigation.
A Route Handler can attach the resolved identifier to its logs and response:
import { NextResponse } from "next/server";
import { resolveRequestId } from "@/lib/observability/request-id";
import { logEvent } from "@/lib/observability/logger";

export async function POST(request: Request) {
  const requestId = resolveRequestId(request);
  const startedAt = performance.now();

  try {
    const result = await performOperation({ requestId });

    logEvent({
      level: "info",
      event: "customer.operation.completed",
      request_id: requestId,
      outcome: "succeeded",
      duration_ms: Math.round(performance.now() - startedAt)
    });

    return NextResponse.json(result, {
      headers: { "x-request-id": requestId }
    });
  } catch (error) {
    logEvent({
      level: "error",
      event: "customer.operation.failed",
      request_id: requestId,
      outcome: "failed",
      error_code: classifyError(error),
      duration_ms: Math.round(performance.now() - startedAt)
    });

    return NextResponse.json(
      {
        error: "The operation could not be completed.",
        requestId
      },
      {
        status: 500,
        headers: { "x-request-id": requestId }
      }
    );
  }
}
Returning the request ID is particularly useful for customer support. Instead of asking a customer for screenshots and approximate timestamps, support can request the reference shown on the error screen.
The customer-facing message should remain safe:
We could not complete this request.

Reference: req_01K1A6R98CXQ
It should not expose stack traces, SQL errors, provider secrets, or internal architecture.
Use a Workflow ID for Work That Outlives the Request
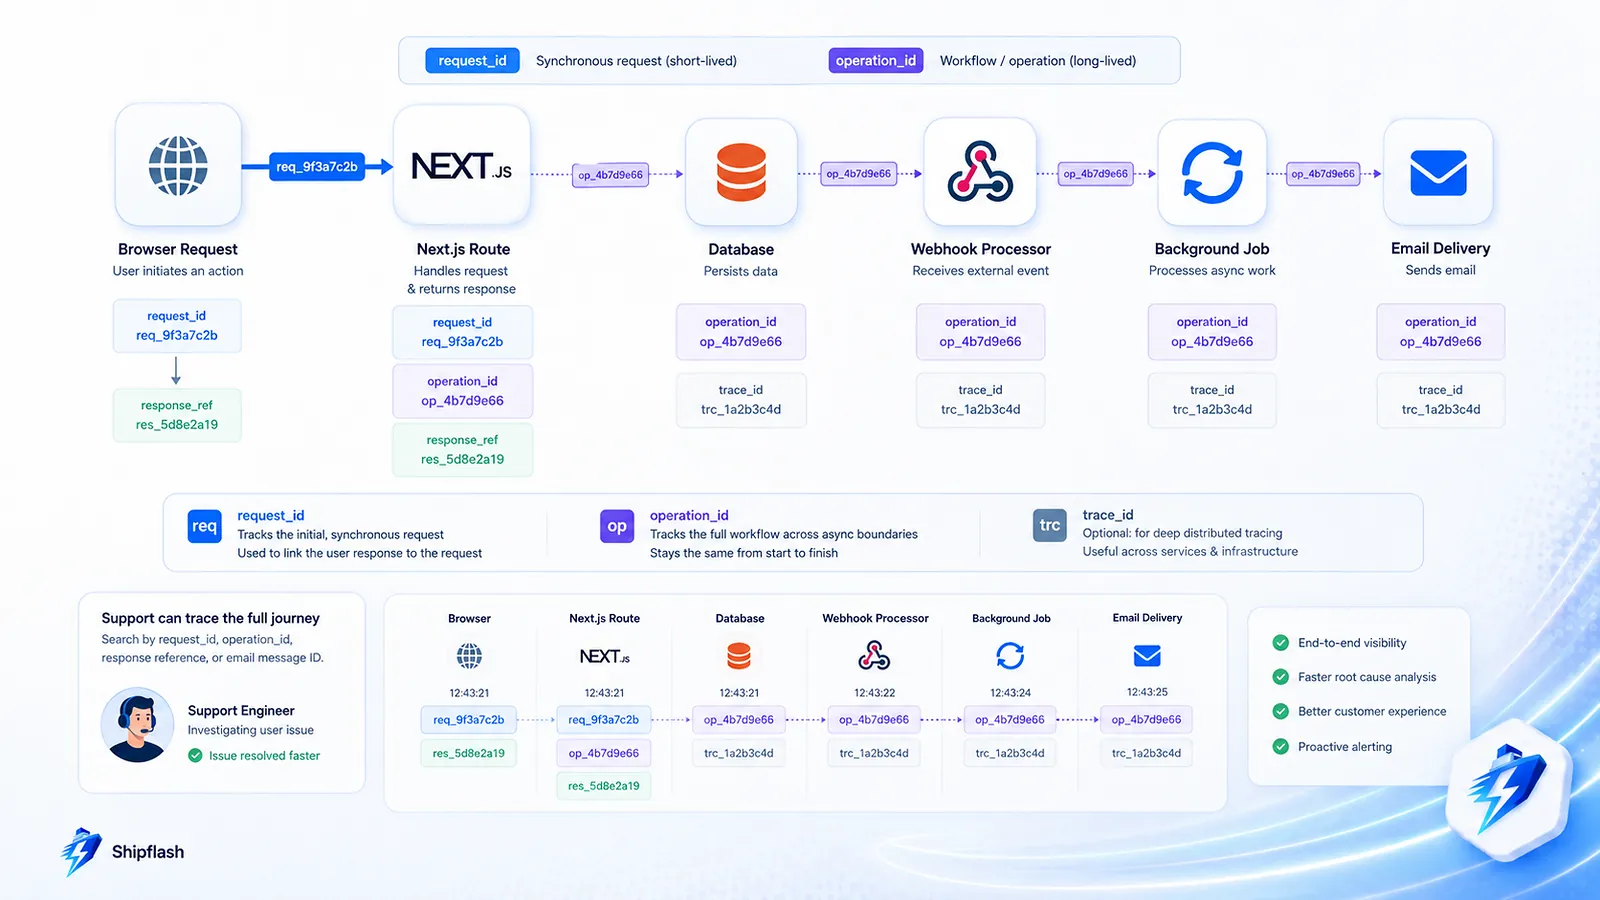
A request ID is not enough for asynchronous work.
Consider a checkout workflow:
- A customer requests a checkout session.
- The payment provider creates the session.
- The customer completes payment several minutes later.
- A webhook is delivered.
- A background worker processes the event.
- The application updates the entitlement.
- A receipt email is sent.
Those steps do not share one HTTP request.
They need a durable workflow or operation ID that can be stored with each related record.
operation_id = billing_purchase_01K1A7E1P9RZ
The operation ID can appear in the checkout record, provider metadata, webhook event history, entitlement update, email outbox record, and audit history.
This allows the entire customer journey to be reconstructed even when it spans multiple requests, providers, and background workers.
Do not place secrets or sensitive personal information in trace context or OpenTelemetry baggage. OpenTelemetry warns that baggage can be propagated to downstream services and third-party endpoints through request headers. Use opaque internal identifiers, and explicitly control which values are allowed to leave the application boundary.
Add OpenTelemetry Without Making It the Architecture
Next.js supports an instrumentation.ts file that runs when a server instance starts. The official Next.js instrumentation guide shows how it can register OpenTelemetry or another monitoring integration.
A basic Vercel OpenTelemetry setup looks like this:
import { registerOTel } from "@vercel/otel";

export function register() {
  registerOTel({
    serviceName: "shipflash-saas"
  });
}
This gives you framework-level tracing without manually wrapping every function. You can then add custom spans around domain operations where framework traces do not provide enough meaning.
import { trace, SpanStatusCode } from "@opentelemetry/api";

const tracer = trace.getTracer("billing");

export async function reconcileBillingAccount(accountId: string) {
  return tracer.startActiveSpan(
    "billing.reconcile_account",
    {
      attributes: {
        "billing.account_ref": accountId
      }
    },
    async (span) => {
      try {
        const result = await runReconciliation(accountId);

        span.setAttribute("billing.records_updated", result.updated);
        span.setStatus({ code: SpanStatusCode.OK });

        return result;
      } catch (error) {
        span.recordException(error as Error);
        span.setStatus({
          code: SpanStatusCode.ERROR,
          message: "Billing reconciliation failed"
        });

        throw error;
      } finally {
        span.end();
      }
    }
  );
}
The span name describes a business operation rather than a filename or utility function. That makes the trace understandable after the code has been reorganized.
Next.js recommends OpenTelemetry as a platform-agnostic approach, and Vercel provides @vercel/otel for simpler integration. Custom manual OpenTelemetry configuration may require runtime-specific handling because Node-oriented SDKs are not automatically compatible with every edge runtime.
The goal is not to trace every line of code. High-volume traces can become expensive and noisy. Instrument the boundaries where meaningful work changes state:
| Boundary | Useful span |
|---|---|
| External provider request | billing.provider.fetch_subscription |
| Database transaction | billing.apply_entitlement |
| Email enqueue | notification.enqueue |
| Background job | job.process_batch |
| File operation | export.generate_csv |
| Authorization decision | access.evaluate_permission |
Automatic instrumentation explains framework behavior. Custom spans explain product behavior.
You need both, but the custom layer should remain selective.
Make Supabase Part of the Same Investigation
Supabase provides several observability surfaces, including product-specific logs, a Logs Explorer, and reports for database, Auth, Storage, Realtime, and API systems.
The Supabase Logs Explorer exposes sources such as auth_logs, edge_logs, function_logs, postgres_logs, storage_logs, and Realtime logs. Its reports include infrastructure and database signals such as memory usage, CPU usage, disk operations, and connection activity.
Each source answers a different part of the investigation.
| Supabase source | Useful questions |
|---|---|
| Auth logs | Did authentication reject the request? Was a token invalid or expired? |
| API and edge logs | Which endpoint responded, with what status and latency? |
| Postgres logs | Did a database error, lock, timeout, or statement failure occur? |
| Function logs | Did an Edge Function start, fail, or exceed expected execution time? |
| Storage logs | Did an upload or download fail because of access or object state? |
| Database reports | Are CPU, memory, I/O, or connections approaching pressure? |
The application should add the missing domain context.
Supabase can show that an API request returned an error. Your structured event should show that the request was attempting to activate a paid account.
Supabase can show a failed database statement. Your application should show whether the statement belonged to checkout, profile creation, an administrator action, or a scheduled cleanup.
Observe Database Behavior at the Query Boundary
Do not log full SQL queries or customer data by default. Record an operation name, duration, result count, and safe error classification.
const startedAt = performance.now();

const { data, error } = await supabase
  .from("subscriptions")
  .select("id,status,provider_subscription_id")
  .eq("customer_id", customerId)
  .maybeSingle();

logEvent({
  level: error ? "error" : "info",
  event: "billing.subscription.lookup",
  request_id: requestId,
  customer_ref: customerId,
  outcome: error ? "failed" : "succeeded",
  error_code: error ? classifyPostgresError(error) : undefined,
  duration_ms: Math.round(performance.now() - startedAt),
  result_count: data ? 1 : 0
});
This gives you application-level timing without copying the entire query or returned row into logs.
For broader capacity questions, use database reports and query analysis rather than expanding every request log. If connection pressure, caching, query plans, or database throughput are the main problem, see the Shipflash guide to scaling a Next.js and Supabase SaaS.
Treat Webhooks as Durable Message Processing
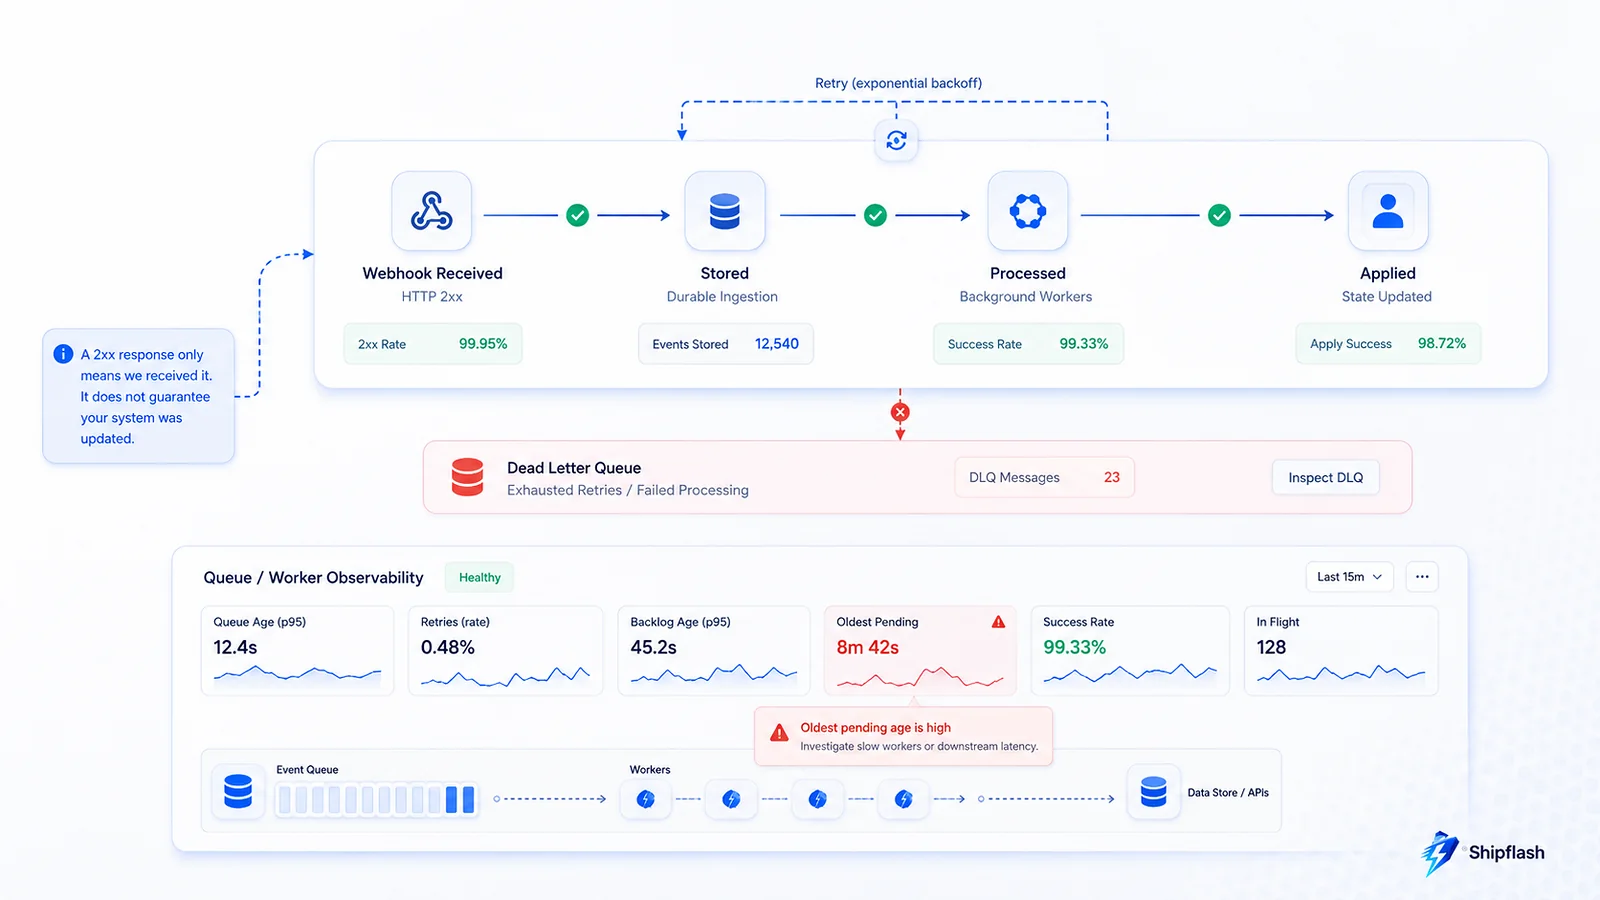
Webhooks are one of the most important observability boundaries in a SaaS because they connect an external provider’s state to your internal state.
A successful HTTP response from your webhook endpoint does not necessarily mean the business change was applied correctly. Likewise, a repeated webhook does not necessarily represent a new customer action.
Your event history should distinguish at least four moments:
| Moment | Meaning |
|---|---|
| Received | The endpoint accepted a signed provider event |
| Stored | The raw event reference was recorded durably |
| Processed | The handler evaluated the event |
| Applied | The expected internal state transition completed |
A useful webhook record might contain:
provider_event_id
provider_event_type
received_at
processing_started_at
processed_at
applied_at
processing_status
attempt_count
last_error_code
request_id
operation_id
payload_version
This model exposes several otherwise invisible failure states:
Received but never processed
Processed but not applied
Applied after multiple retries
Duplicate event safely skipped
Unsupported event deliberately ignored
Permanent failure requiring operator review
Stripe documents that live webhook deliveries may be retried for up to three days, duplicate events can occur, and event ordering is not guaranteed. Stripe therefore recommends logging processed event IDs, handling events asynchronously, and avoiding dependencies on delivery order.
That means the webhook system should be observable as a message processor, not treated as a normal form submission.
For the broader implementation model, including entitlements, reconciliation, idempotency, refunds, and provider state, read the Shipflash guide to SaaS billing architecture.
Observe Background Jobs Through Progress, Not Invocation
A cron platform may report that it called your endpoint successfully. That does not prove the intended work completed.
A scheduled billing reconciliation might return 200 OK after claiming a batch but fail before processing any accounts. A cleanup job might execute successfully while finding no rows because its selection condition is wrong. A worker might repeatedly process the same records without making progress.
Every background job should expose:
| Signal | What it reveals |
|---|---|
| Last started time | Is the scheduler invoking it? |
| Last completed time | Is work finishing? |
| Claimed count | Did the job find eligible work? |
| Processed count | Did it make progress? |
| Failed count | How much work needs attention? |
| Oldest pending age | How long has work been waiting? |
| Attempt distribution | Are retries accumulating? |
| Lease expirations | Are workers crashing or timing out? |
| Dead-letter count | Has work exceeded automatic recovery? |
| Duration | Is execution approaching platform limits? |
The strongest queue metric is often not queue length. It is the age of the oldest eligible item.
A queue containing 1,000 new events may be healthy if workers process them quickly. A queue containing three events may represent a serious incident if the oldest has been waiting for six hours.
This is why backlog age frequently provides a better customer-impact signal than raw volume.
For a deeper explanation of leases, retries, idempotency, dead-letter handling, cron execution, and durable workflows, see What Should Run in the Background?.
Connect Email Acceptance to Customer Outcomes
Transactional email has several distinct states:
Created → Enqueued → Sent to provider → Delivered to receiving server
                                      ↘ Delayed
                                      ↘ Bounced
                                      ↘ Complained
                                      ↘ Failed
Do not collapse them into one sent boolean.
Resend distinguishes events such as email.sent, email.delivered, email.delivery_delayed, email.bounced, email.complained, and email.failed. Its webhook documentation also states that delivery is at least once and event order is not guaranteed, so webhook consumers must be idempotent and able to handle out-of-order updates.
For observability, store the provider message ID and connect it to the application operation that requested the email.
| Field | Example |
|---|---|
| Notification ID | Internal durable record |
| Operation ID | Password-reset workflow |
| Template key | auth.password_reset |
| Template version | v4 |
| Provider message ID | Resend email identifier |
| Enqueued time | When the app requested delivery |
| Provider accepted time | When the API accepted the message |
| Delivery time | When the receiving server accepted it |
| Final state | Delivered, failed, bounced, or suppressed |
| Last error code | Stable internal category |
This allows support to answer a customer without searching several dashboards:
The reset request was created at 14:03.
The message was accepted by the provider at 14:03.
Delivery was delayed by the recipient server at 14:04.
It was delivered at 14:11.
The distinction between “sent” and “delivered” is explored further in Your SaaS Email Was Sent—But Did It Arrive?.
Measure the Four Golden Signals—Then Add Product Signals
Google’s Site Reliability Engineering guidance identifies latency, traffic, errors, and saturation as the four golden signals of monitoring. These provide a useful baseline for user-facing services.
For a SaaS, they can be adapted as follows.
| Golden signal | SaaS implementation |
|---|---|
| Latency | Route, Server Action, database, provider, and job duration |
| Traffic | Requests, signups, checkouts, webhooks, emails, and jobs |
| Errors | Failed requests, rejected auth, processing failures, provider errors |
| Saturation | Database connections, queue age, concurrency, CPU, memory, quotas |
These signals tell you whether infrastructure and execution are healthy.
Product signals tell you whether customers received the promised result.
| Product signal | Why it matters |
|---|---|
| Paid customers without active access | Detects broken revenue-to-entitlement flow |
| Verified users without completed profiles | Detects incomplete onboarding |
| Password resets not delivered within target | Detects blocked account recovery |
| Webhook events pending beyond target | Detects integration drift |
| Scheduled jobs overdue | Detects silent automation failure |
| Refunds without corresponding access review | Detects billing-state inconsistency |
| Reconciliation mismatch count | Detects disagreement between provider and local state |
A dashboard that shows zero server errors while three paid users lack access is not a healthy dashboard.
Avoid High-Cardinality Metrics
Metrics are designed for aggregation. They become expensive and difficult to query when every measurement contains unique attributes.
Do not use raw user IDs, request IDs, email addresses, complete URLs, webhook IDs, or error messages as metric dimensions.
A metric like this can grow without bound:
http_request_duration{
  user_id="unique-user",
  request_id="unique-request",
  raw_path="/customers/unique-id"
}
Prefer bounded dimensions:
http_request_duration{
  route="/customers/[id]",
  method="GET",
  status_class="2xx",
  environment="production"
}
Keep request IDs and customer references in logs and traces, where high-cardinality search is expected. Use metrics to detect the pattern, then logs and traces to investigate individual cases.
OpenTelemetry’s metrics guidance warns that high-cardinality attributes such as user IDs and raw URL paths can create unbounded aggregation state and memory cost.
Define Reliability From the User’s Perspective
An SLO, or service-level objective, defines the reliability target for a user-visible capability.
It should measure outcomes rather than the health of an internal component.
A weak objective is:
Supabase is available 99.9% of the time.
A stronger objective is:
99.9% of authenticated dashboard requests complete successfully
within two seconds over a rolling 30-day period.
The second objective remains meaningful even if the database is technically online but requests are timing out because of connection pressure or an inefficient query.
Possible SaaS objectives include:
| Capability | Example objective |
|---|---|
| Authentication | 99.9% of valid login attempts establish a session |
| Dashboard access | 99.9% of requests succeed within two seconds |
| Billing updates | 99.95% of verified billing events are applied within five minutes |
| Transactional email | 99% of critical emails are accepted for delivery within two minutes |
| Scheduled work | 99.9% of scheduled executions begin within their allowed window |
| Data export | 99% of valid exports complete within ten minutes |
These are examples, not universal targets. Choose thresholds based on customer expectations, product maturity, cost, and the consequences of failure.
A target only becomes useful when the system records enough evidence to calculate it.
Alert on Customer Impact and Required Action
An alert should not merely report that something looks unusual. It should tell the responder why the condition matters and what action may be required.
Google’s SRE guidance argues that human notification should be reserved for situations where a person needs to take action. Less urgent conditions should become tickets or dashboard signals rather than immediate interruptions.
A practical alert definition contains:
| Field | Example |
|---|---|
| Condition | Oldest verified billing event exceeds 10 minutes |
| User impact | Paid access may be delayed |
| Scope | 14 pending events across 12 customers |
| Started | 17:04 UTC |
| Recent change | Release 9db81c4 deployed at 16:57 UTC |
| Investigation | Link to filtered dashboard or query |
| Runbook | Billing-event backlog procedure |
| Safe mitigation | Pause deployment, replay idempotently |
| Owner | Billing operations |
Avoid paging on every individual exception. A transient provider timeout that succeeds on retry does not necessarily require human intervention.
Page when automation is unable to preserve the customer promise.
| Situation | Appropriate response |
|---|---|
| One retryable provider timeout | Record and retry |
| Error rate briefly above baseline | Dashboard observation |
| Backlog growing but within recovery target | Ticket or warning |
| Critical workflow exceeding its SLO | Urgent alert |
| Paid customers consistently missing access | Immediate investigation |
| Telemetry pipeline stopped reporting | Operational alert |
Build Dashboards Around Decisions
A dashboard should answer a question. It should not become a collection of every available chart.
A small SaaS usually needs four operational views.
Customer Outcome View
This answers: “Are customers completing critical workflows?”
It includes successful and failed signups, login outcomes, checkout completions, entitlement delays, transactional email states, and support-impacting failures.
Execution Health View
This answers: “Is the application processing work correctly?”
It includes route latency, error rate, background-job duration, queue age, retry volume, webhook processing status, and dead-letter counts.
Dependency View
This answers: “Is an external or infrastructure dependency limiting the product?”
It includes database connections and latency, provider API failures, email-provider responses, storage errors, and hosting-level function behavior.
Change Correlation View
This answers: “Did a release or configuration change introduce the problem?”
It includes deployment versions, migration times, feature-flag changes, provider configuration changes, and the start time of significant incidents.
Every chart should connect to a next action. If nobody knows what to do when a chart changes, it probably does not belong on the primary operations dashboard.
A Worked Incident: The Customer Paid but Has No Access
Consider a customer who reports that payment succeeded but the dashboard still shows the free plan.
Without structured observability, the investigation may involve manually checking Stripe, searching application logs by timestamp, opening the database, and guessing which deployment was active.
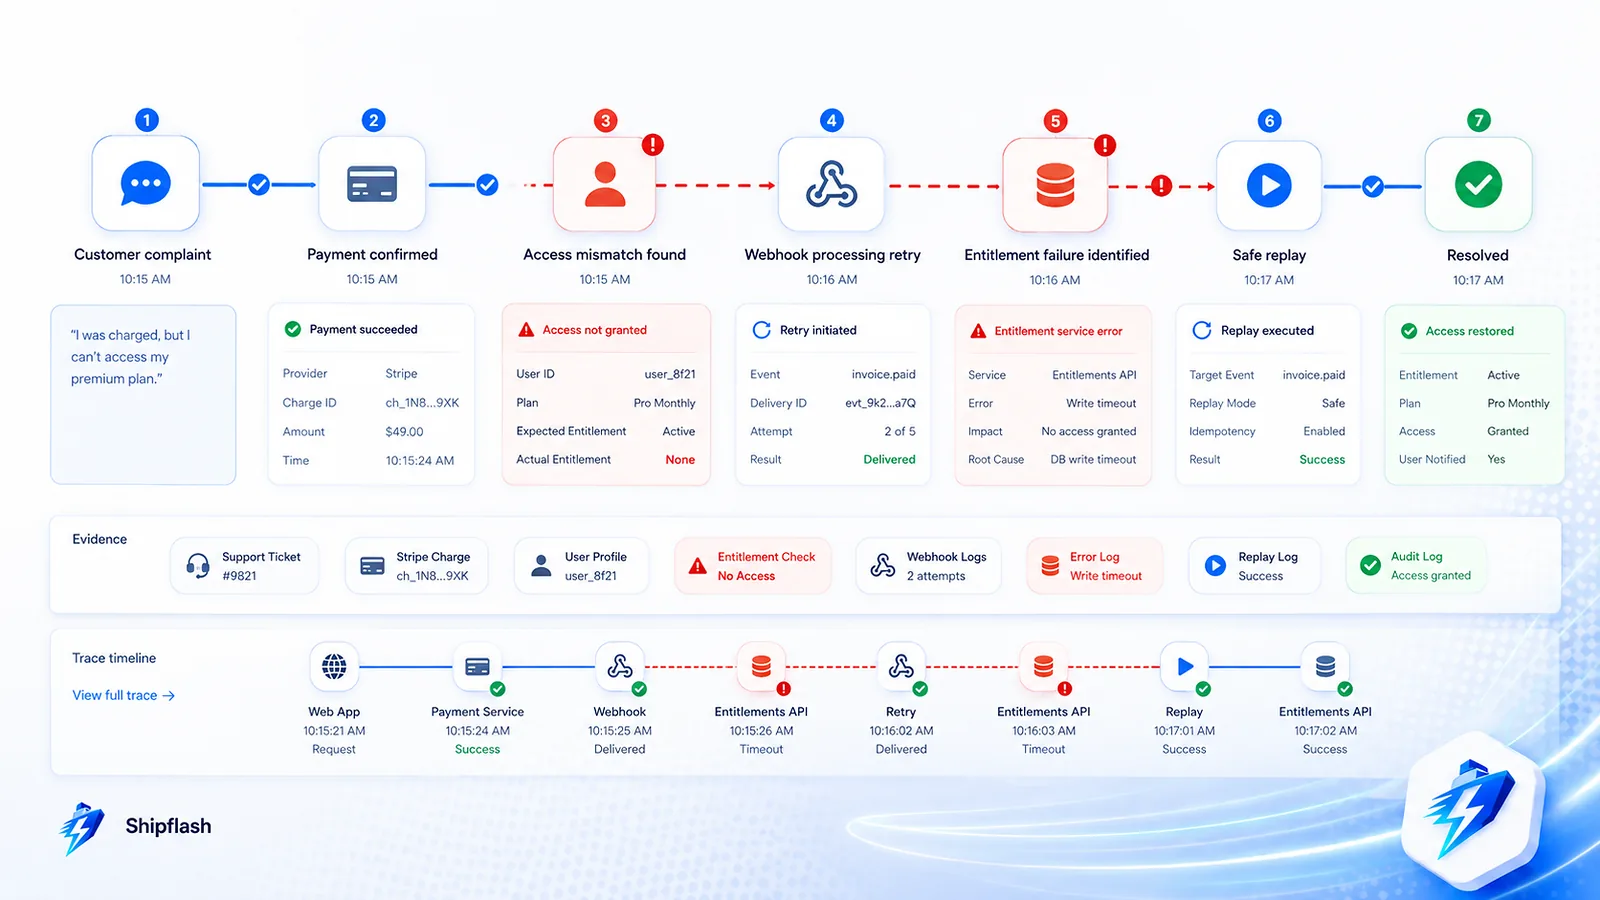
With an evidence ladder, the investigation becomes deterministic.
1. Start With the Customer Record
Support searches the internal customer reference and sees:
Provider payment status: paid
Local subscription status: incomplete
Entitlement: free
Reconciliation status: mismatched
The issue is immediately classified as a provider-to-local-state failure rather than a checkout failure.
2. Follow the Operation ID
The checkout record contains:
operation_id: billing_purchase_01K1A7E1P9RZ
provider_session_id: cs_...
provider_customer_id: cus_...
Searching the operation ID returns the webhook event, processing attempt, entitlement update, and notification record.
3. Inspect the Webhook History
The event history shows:
received_at: 17:03:11
processing_started_at: 17:03:12
processed_at: null
processing_status: retrying
attempt_count: 3
last_error_code: entitlement_write_conflict
This proves that the provider delivered the event and the application accepted it. The failure occurred while applying local state.
4. Open the Trace
The trace shows:
billing.webhook.handle
  ├── billing.customer.resolve             42 ms
  ├── billing.subscription.upsert          63 ms
  └── billing.entitlement.apply            error
The entitlement span contains the deployment version and safe error classification. Related logs reveal that a newly added unique constraint rejected the write.
5. Repair Through an Idempotent Operation
An operator uses a controlled replay action.
The system verifies the event signature history, checks that the event has not already been applied, reruns the state transition, and writes an audit record with the operator, reason, and result.
The repair does not require editing the database directly.
For guidance on turning these investigations and repair actions into a secure operator workspace, read the SaaS admin operations playbook.
6. Close the Observability Gap
After recovery, the team adds a product-level alert:
paid_provider_records_without_entitlement > 0 for 5 minutes
The next occurrence is detected before a customer reports it.
That is the real value of observability: not merely finding one exception, but converting the incident into a signal that prevents silent recurrence.
Protect Secrets and Customer Data
Telemetry frequently becomes one of the largest collections of sensitive information in a product.
A careless error handler can record access tokens, session cookies, email addresses, payment details, SQL statements, request bodies, password-reset URLs, or provider secrets.
OWASP recommends excluding or sanitizing session identifiers, access tokens, passwords, database connection strings, encryption keys, payment information, and sensitive personal data. It also recommends protecting logs from unauthorized access, tampering, and excessive retention.
Use a deny-by-default approach.
| Data | Recommended treatment |
|---|---|
| Passwords and secrets | Never log |
| Session and access tokens | Never log |
| Authorization headers | Remove entirely |
| Email addresses | Mask, hash, or replace with internal reference |
| Provider payloads | Store only required fields or protect raw payload access |
| Database errors | Classify before sending to customer-facing logs |
| Request bodies | Allowlist specific safe fields |
| IP addresses | Retain only when operationally justified |
| Customer-generated content | Do not log by default |
| Reset and verification URLs | Never log complete tokenized links |
Sanitization must happen before the event reaches the telemetry provider. Removing secrets from a dashboard after collection does not remove them from ingestion pipelines, archives, exports, or backups.
Logging access should also be audited. Production logs may reveal customer behavior, revenue signals, internal architecture, and security events.
Write Runbooks Before the Alert Fires
An alert without a runbook transfers the reasoning burden to the person responding under pressure.
A lightweight runbook should contain enough information to verify the incident and perform a safe first response.
Alert:
Billing events are pending beyond the five-minute objective.

Customer impact:
Paid access, plan changes, or cancellations may be delayed.

Verify:
1. Confirm the oldest pending event age.
2. Check whether new events are still arriving.
3. Compare provider state with local billing state.
4. Review recent releases and database migrations.
5. Identify the dominant error code.

Safe mitigation:
Pause the affected worker or deployment if it is creating incorrect state.
Do not delete provider events.
Do not modify entitlements directly without an audit record.

Recovery:
Replay failed events through the idempotent processing path.
Run reconciliation for affected customers.
Confirm backlog age returns to normal.

Escalation:
Escalate if signatures cannot be verified, provider state is inconsistent,
or the replay path produces additional state changes.

After recovery:
Record the incident, affected scope, root cause, and missing detection signal.
Runbooks should link directly to filtered queries, dashboards, repair tools, and provider views. Avoid instructions such as “check the logs,” which simply move the investigation problem elsewhere.
Common Observability Mistakes
| Mistake | Why it fails | Better approach |
|---|---|---|
| Logging only exceptions | Successful but incorrect outcomes remain invisible | Record important state transitions and outcomes |
| Using logs as business truth | Retention and sampling can remove evidence | Store durable provider and state history |
| Logging entire payloads | Creates security, privacy, and cost risks | Allowlist safe fields |
| No request or operation ID | Events cannot be connected | Propagate bounded identifiers |
| Alerting on every error | Creates fatigue and ignored alerts | Alert on impact and failed recovery |
| Monitoring only HTTP status | Background and provider failures remain hidden | Observe complete customer journeys |
| Metrics labeled by user ID | Produces high-cardinality cost and performance problems | Keep unique identifiers in logs and traces |
| No release metadata | Regressions are difficult to correlate | Attach deployment version to telemetry |
| No operator audit trail | Repairs become another unexplained change | Record reason, actor, target, and outcome |
| Dashboard without runbooks | Charts do not reduce recovery time | Connect every critical signal to an action |
A Practical Implementation Order
Observability does not need to be built in one large project.
| Phase | Work | Immediate value |
|---|---|---|
| Foundation | Structured logger, error taxonomy, request IDs, release metadata | Searchable and consistent evidence |
| Critical workflows | Signup, billing, email, jobs, and admin events | Visibility into customer outcomes |
| Correlation | Operation IDs and OpenTelemetry traces | End-to-end incident investigation |
| Operations | Dashboards, SLOs, alerts, runbooks, replay tools | Faster detection and recovery |
| Governance | Retention, access controls, redaction tests, audit review | Safer long-term operation |
Begin with the workflows where failure causes lost revenue, blocked access, security exposure, or irreversible customer harm.
Do not start by instrumenting low-risk UI interactions while payment and account-recovery workflows remain opaque.
Frequently Asked Questions
What is the difference between monitoring and observability?
Monitoring detects known conditions using predefined metrics, thresholds, and alerts. Observability provides enough connected evidence to investigate both known and unexpected failures. Monitoring might report that webhook failures increased; observability helps explain which customers were affected, which event type failed, where processing stopped, and how the event can be replayed safely.
Does a small SaaS really need distributed tracing?
A small SaaS does not need to trace every operation. Tracing becomes valuable when one customer workflow crosses several boundaries, such as Next.js, Supabase, a payment provider, a queue, and an email service. Selective tracing around these critical workflows can provide substantial value without enterprise-level complexity.
Should application logs be stored in Supabase?
Durable business and operational records can belong in Supabase, including webhook history, notification status, reconciliation results, and audit events. High-volume request logs and traces are usually better suited to a dedicated telemetry backend. Avoid using the primary application database as an unlimited log archive.
What should trigger an alert?
Alert when a customer-facing promise is actively failing, automatic recovery is not working, or immediate human action can reduce impact. A single retryable error generally should not page someone. A growing payment-event backlog or paid customers missing access usually should.
How long should logs be retained?
Retention depends on operational needs, plan limits, privacy obligations, security requirements, and cost. Keep durable business and audit records according to their own policies. Retain detailed telemetry only as long as it remains useful for investigation, trend analysis, and incident response.
What is the most important observability field?
There is no single universal field, but a stable operation ID often provides the greatest value for multi-step SaaS workflows. It connects requests, provider events, jobs, database changes, notifications, and operator actions that occur at different times.
Can observability prevent production failures?
Observability does not prevent every failure. It reduces the time between failure, detection, explanation, and safe recovery. It also produces evidence that can be converted into tests, alerts, constraints, and repair workflows, making repeated failures less likely.
Observability Is a Product Capability
A production SaaS is not observable because it has an error-tracking SDK installed.
It is observable when the team can answer:
Which customer journey failed?
Who is affected?
Where did execution stop?
What state exists now?
Is automated recovery working?
Can the operation be replayed safely?
Which release or configuration introduced the behavior?
What signal will detect the next occurrence sooner?
The strongest observability systems connect technical execution to customer outcomes. They preserve important state transitions, correlate work across asynchronous boundaries, expose operational delays, protect sensitive data, and provide responders with safe recovery paths.
That is what turns production failures from vague customer complaints into diagnosable and repairable events—and what allows a SaaS team to keep shipping without operating blindly.