

Your payment provider says you have $11,860 in monthly recurring revenue.
Your internal dashboard says $12,400.
The spreadsheet you update before investor calls says $13,200.
That does not automatically mean one system is broken. Each number may be following a different rule for annual subscriptions, discounts, past-due accounts, refunds, currencies, usage charges, or customers who canceled but still have paid access.
The problem is not usually the chart.
The problem is that the metric was never defined precisely enough for the chart to have one defensible answer.
A trustworthy SaaS analytics dashboard starts with business definitions, event history, identity rules, and reproducible calculations. The visual interface comes last.
This guide explains how to measure monthly recurring revenue, activation, retention, and churn without creating a dashboard that looks precise while quietly changing its meaning underneath you.
What Makes a SaaS Analytics Dashboard Trustworthy?
A trustworthy SaaS analytics dashboard produces metrics from documented definitions, stable source data, consistent time windows, and testable calculations. Every number should explain what it includes, what it excludes, when it was measured, which customer identity it uses, and how an operator can trace it back to the underlying records.
The dashboard should help you answer questions such as:
Did revenue grow because we acquired more customers, retained existing ones, expanded accounts, or changed the calculation?
Without that level of explanation, a rising line may look encouraging while concealing increased churn, weak activation, temporary annual payments, or a reporting change.
Why SaaS Dashboards Disagree Even When Nobody Is Lying
Most metric disagreements begin with an unstated decision.
One tool may count a subscription as active when it starts. Another may wait for the first successful payment. One may include past-due subscriptions in MRR, while another removes them immediately. A third may subtract every discount and refund from the month in which it happened.
Stripe, for example, lets businesses configure parts of their Billing metric definitions, including how discounts and active subscribers affect reporting. Its published MRR definition also distinguishes trials, taxes, free plans, metered products, active subscriptions, and past-due subscriptions. That flexibility is useful, but it means a provider dashboard is not a universal definition of your business metrics. Review the current Stripe Billing analytics documentation before attempting to reproduce its numbers internally.
Common causes of disagreement include:
| Decision | Definition A | Definition B | Result |
|---|---|---|---|
| Annual subscriptions | Divide contract value by 12 | Count the full invoice when paid | Different monthly revenue |
| Past-due accounts | Remain in MRR during recovery | Churn immediately after failure | Different MRR and churn |
| Discounts | Reduce recurring value | Report full list price | Different MRR |
| Trial accounts | Count at trial start | Count only after payment | Different active customer totals |
| Cancellation | Churn on request date | Churn at paid period end | Different churn timing |
| Lifetime purchases | Include in monthly revenue | Exclude from recurring revenue | Inflated or accurate MRR |
| Currency conversion | Use current FX rate | Lock the event-date rate | Different consolidated totals |
| Customer identity | Count subscriptions | Count billing customers or workspaces | Different customer churn |
The correct choice depends on what you are trying to measure. The important requirement is to choose deliberately and apply the same choice across reports.
Separate Recurring Revenue From Money Received
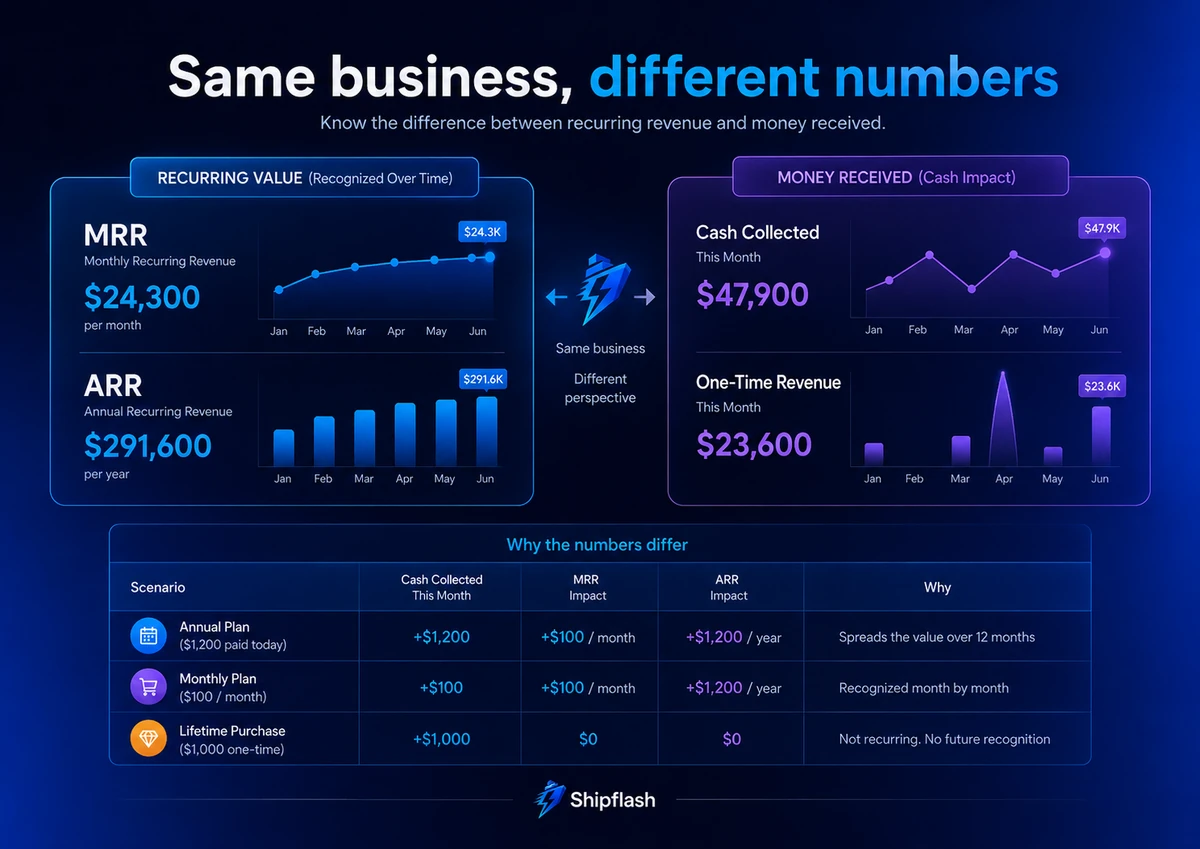
MRR is not cash collected, bookings, accounting revenue, or total sales.
These numbers can move together, but they describe different parts of the business.
| Metric | What it answers | Typical source |
|---|---|---|
| Cash collected | How much money reached the payment account? | Successful charges, refunds, fees |
| Gross sales | What value was sold before deductions? | Orders and completed transactions |
| Bookings | What contract value did customers commit to? | Contracts, subscriptions, sales records |
| MRR | What normalized recurring subscription value is active? | Subscription and recurring price state |
| ARR | What is the annualized recurring run rate? | MRR × 12 |
| Recognized revenue | What revenue belongs to the accounting period? | Accounting or revenue-recognition records |
| One-time revenue | What non-recurring purchases were completed? | Lifetime purchases, setup fees, credit packs |
A founder can have a strong cash month without adding much MRR. An annual customer may pay $1,200 today while contributing $100 to normalized MRR. A $249 lifetime purchase creates cash and one-time revenue, but it should not add $249 to recurring monthly revenue.
Conversely, an active monthly subscription may contribute to MRR even if the latest invoice is still inside a deliberately defined payment-recovery window.
The MRR Roll-Forward Formula
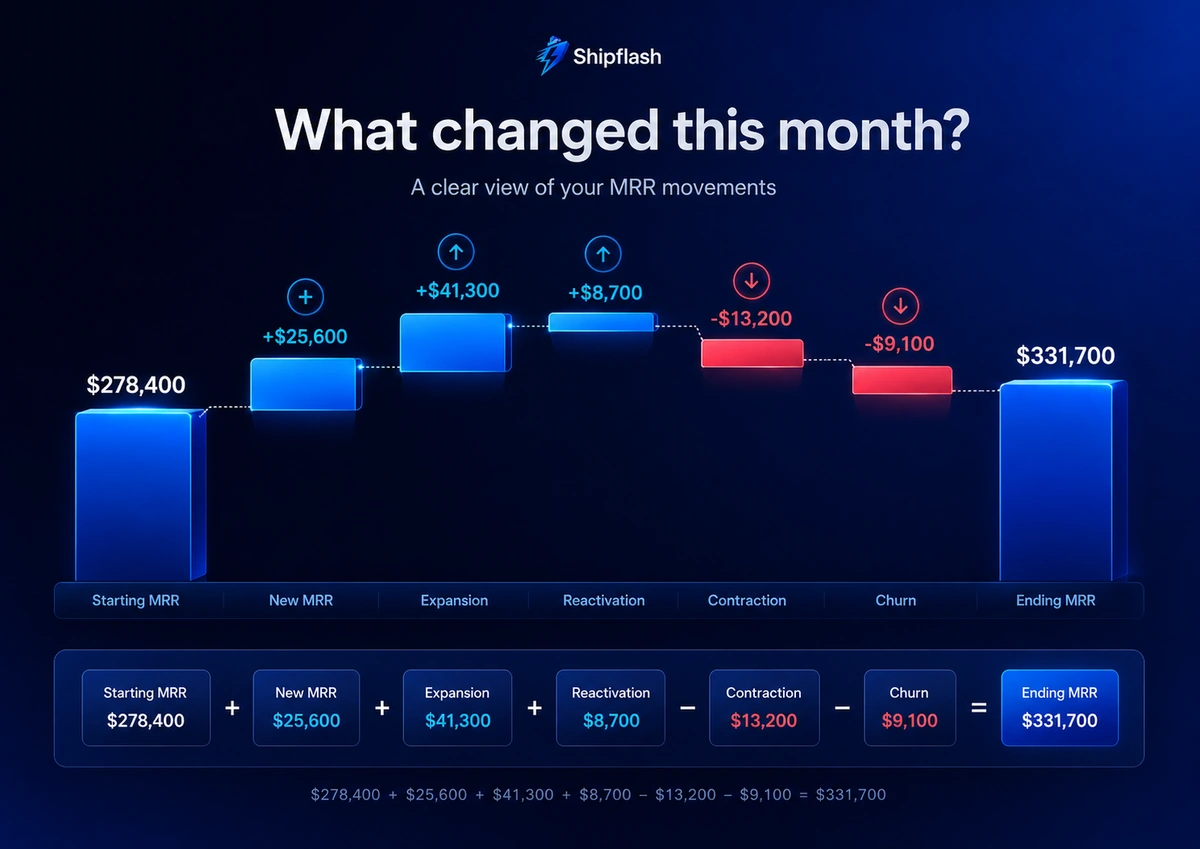
A useful MRR report does not display only the ending balance. It explains how the balance changed.
Ending MRR =
  Starting MRR
  + New MRR
  + Expansion MRR
  + Reactivation MRR
  - Contraction MRR
  - Churned MRR
  ± FX adjustment
The five main customer-driven movements are:
| Movement | Meaning |
|---|---|
| New MRR | Recurring revenue from a customer becoming paid for the first time |
| Expansion MRR | Additional recurring value from an existing customer |
| Contraction MRR | Recurring value lost through a downgrade or reduced quantity |
| Churned MRR | Recurring value lost when the customer stops contributing MRR |
| Reactivation MRR | Recurring value restored when a previously churned customer returns |
This movement-based model is widely used in subscription analytics because it makes growth explainable instead of presenting MRR as an isolated total. ChartMogul’s SaaS metrics library and its guidance on gross and net churn use the same underlying distinction between recurring revenue gained and recurring revenue lost.
How Should Difficult Billing Cases Affect MRR?
The dangerous approach is to resolve each edge case wherever it appears in the UI. That creates multiple definitions inside the same application.
Use one normalized billing layer and document decisions there.
| Billing case | Recommended treatment |
|---|---|
| Monthly subscription | Include its current normalized recurring amount |
| Annual subscription | Divide recurring contract value by 12 |
| Free trial | Exclude until the chosen paid-activation condition |
| Permanent recurring discount | Reduce normalized MRR |
| One-time coupon | Follow one documented policy consistently |
| Past-due subscription | Apply a documented recovery or grace-period rule |
| Refunded one-time purchase | Adjust one-time revenue, not MRR |
| Refunded recurring invoice | Record the refund separately and apply the documented MRR policy |
| Lifetime purchase | Exclude from MRR |
| Prepaid credit pack | Exclude from MRR unless it represents a recurring commitment |
| Usage billing | Report separately or estimate only under a clearly labeled policy |
| Multiple currencies | Preserve native currency and create a separately documented base-currency view |
Usage-based revenue deserves special caution. A monthly minimum commitment may qualify as recurring revenue, while variable consumption above that commitment may not be predictable enough to represent as fixed MRR.
Do not label an estimate as settled recurring revenue. A dashboard can include both, but the labels must remain distinct.
Write a Metric Contract Before Writing a Query
A metric contract is the specification that determines what a number means.
It should be readable by the founder, product team, engineer, and anyone reviewing the business. A query that cannot be explained without opening the source code is not a stable company metric.
A practical metric contract contains:
| Field | Example |
|---|---|
| Metric name | Monthly recurring revenue |
| Business question | How much normalized recurring subscription value is active? |
| Entity | Billing account |
| Source | Normalized subscription records and MRR movements |
| Formula | Sum of active normalized recurring values |
| Effective time | End of day in UTC |
| Included states | Active and eligible past-due subscriptions |
| Excluded records | Trials, taxes, free plans, lifetime purchases |
| Currency policy | Native currency plus daily locked USD conversion |
| Owner | Founder or finance owner |
| Version | mrr_v2 |
| Effective date | 2026-08-01 |
| Known limitations | Variable usage excluded |
Versioning is important because definitions change.
Suppose you initially include past-due accounts for 30 days, then reduce the recovery window to 14 days. Historical reports should not silently recalculate every old period under the new rule unless that restatement is intentional.
Record the definition version alongside each snapshot or make the restatement visible.
Build MRR From Movements, Not Only the Current Subscription Row
A mutable subscription table tells you what appears to be true now. It does not fully explain how the business reached that state.
If a customer changes from $50 to $100 and later cancels, one current row may tell you the final status. It cannot reliably reconstruct when expansion happened, how long the higher amount remained active, or which webhook caused each transition.
A stronger model keeps an immutable MRR movement ledger.
create table mrr_movements (
  id uuid primary key default gen_random_uuid(),
  account_id uuid not null,
  subscription_id uuid not null,
  source_event_id text not null,
  movement_type text not null check (
    movement_type in (
      'new',
      'expansion',
      'contraction',
      'churn',
      'reactivation',
      'fx_adjustment'
    )
  ),
  amount_delta_cents bigint not null,
  currency text not null,
  definition_version text not null,
  effective_at timestamptz not null,
  recorded_at timestamptz not null default now(),

  constraint mrr_movements_source_event_unique
    unique (source_event_id, movement_type)
);
The source event should connect the movement to a verified billing event, reconciliation repair, migration, or documented operator action.
This design complements the provider-state, webhook, entitlement, and reconciliation boundaries described in Shipflash’s SaaS billing architecture guide. The billing layer determines what happened commercially; the analytics layer turns those normalized changes into historical measurements.
A monthly roll-forward can then be generated from movement history:
select
  date_trunc('month', effective_at) as month,
  sum(amount_delta_cents)
    filter (where movement_type = 'new') as new_mrr_cents,
  sum(amount_delta_cents)
    filter (where movement_type = 'expansion') as expansion_mrr_cents,
  abs(sum(amount_delta_cents)
    filter (where movement_type = 'contraction')) as contraction_mrr_cents,
  abs(sum(amount_delta_cents)
    filter (where movement_type = 'churn')) as churned_mrr_cents,
  sum(amount_delta_cents)
    filter (where movement_type = 'reactivation') as reactivation_mrr_cents,
  sum(amount_delta_cents)
    filter (where movement_type = 'fx_adjustment') as fx_adjustment_cents,
  sum(amount_delta_cents) as net_mrr_change_cents
from mrr_movements
group by 1
order by 1;
This query is illustrative. Production logic still needs a consistent timezone, currency policy, account model, billing status policy, and opening balance.
Preserve Historical Snapshots
Movement history explains changes. Snapshots make period-end reporting fast and reproducible.
create table monthly_mrr_snapshots (
  snapshot_month date not null,
  account_id uuid not null,
  ending_mrr_cents bigint not null,
  currency text not null,
  definition_version text not null,
  calculated_at timestamptz not null default now(),

  primary key (
    snapshot_month,
    account_id,
    currency,
    definition_version
  )
);
Do not build every dashboard request by downloading all subscriptions into the browser and recalculating their history in JavaScript.
Historical metrics belong in database queries, scheduled summaries, or materialized reporting models. This reduces data transfer, prevents client-side definitions from drifting, and gives every consumer the same result.
Measure Activation as the First Delivered Value
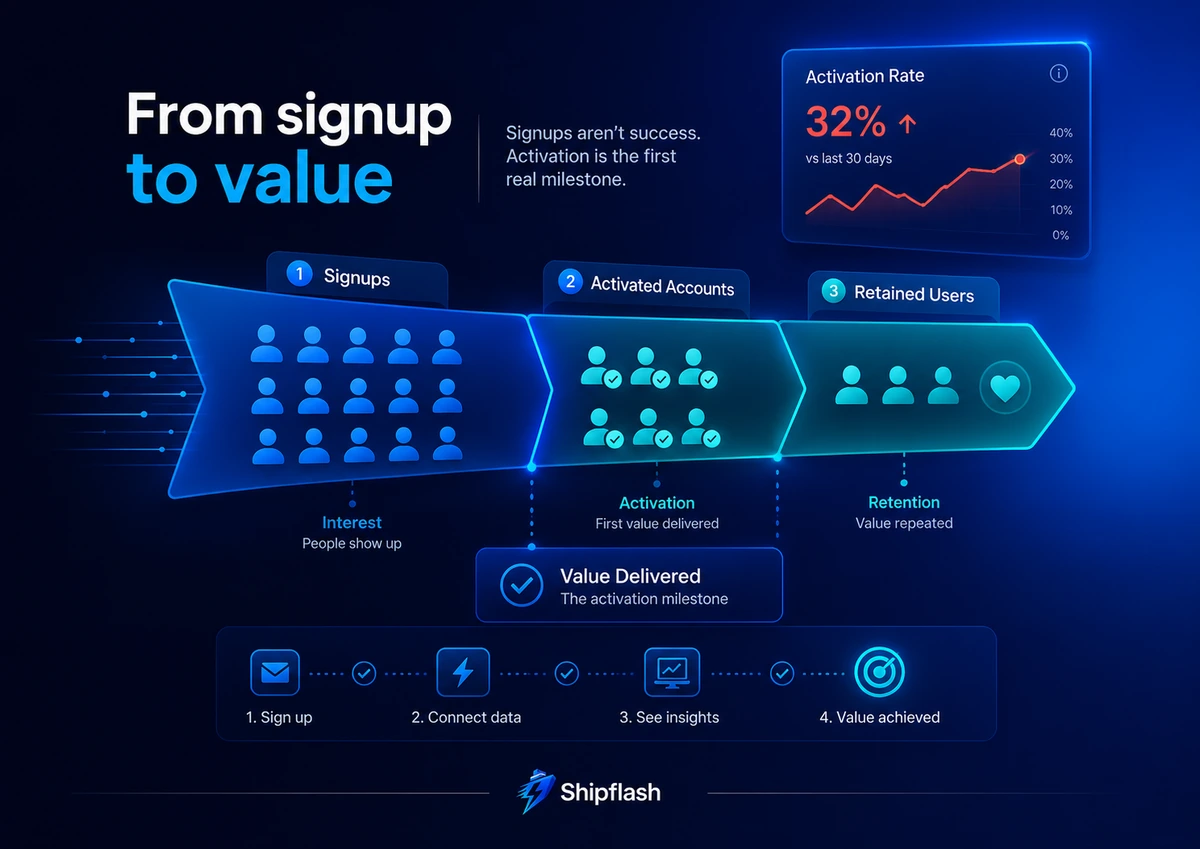
Activation is the percentage of eligible new accounts that reach a meaningful product outcome within a defined period.
A signup is usually not activation.
Creating an account proves that someone completed a form. Activation should indicate that the customer experienced enough value to have a reason to return.
Activation rate =
  Accounts completing the activation condition within the window
  ÷ Eligible new accounts in the cohort
A useful activation definition has three properties:
- It represents value received, not merely interface activity.
- It happens early enough for the team to improve onboarding.
- It predicts a later outcome such as retention, conversion, or expansion.
PostHog describes a practical method for evaluating activation candidates: identify plausible event combinations, define a realistic activation window, and compare the later retention of activated accounts with the overall baseline. Its own products use different activation conditions because activation depends on the value cycle of each product. Read PostHog’s activation metric methodology for a detailed example.
Examples of Stronger Activation Events
| Product type | Weak proxy | Stronger activation condition |
|---|---|---|
| Analytics SaaS | User opened dashboard | Account sent real data and saved an insight |
| Email SaaS | User created account | Domain verified and first campaign delivered |
| Project tool | User created workspace | Project created and another member collaborated |
| AI application | User opened generator | Useful output created, saved, or exported |
| Billing product | User viewed pricing | Checkout completed and entitlement activated |
| Developer tool | User generated an API key | First valid production-like request succeeded |
The activation window must match the product.
A simple consumer tool may activate in one session. A developer platform may require several days for installation, integration, and production data. Using a 24-hour window merely because it produces a convenient report can misclassify healthy customers as failures.
Use the Account as the Activation Entity When Appropriate
In collaborative or B2B SaaS products, activation often belongs to the workspace or customer account rather than one user.
Five members may interact with the same product. Counting each member as a separate activated customer can inflate activation and disconnect it from billing.
Choose the entity based on the buying and value unit:
| Question | Likely entity |
|---|---|
| Who signs in? | User |
| Who collaborates? | Workspace |
| Who receives value? | User or workspace |
| Who pays? | Billing account |
| Who can churn? | Subscriber or account |
Your product event model should preserve these relationships instead of forcing every metric onto user_id.
Measure Retention With Cohorts, Not Returning-User Totals
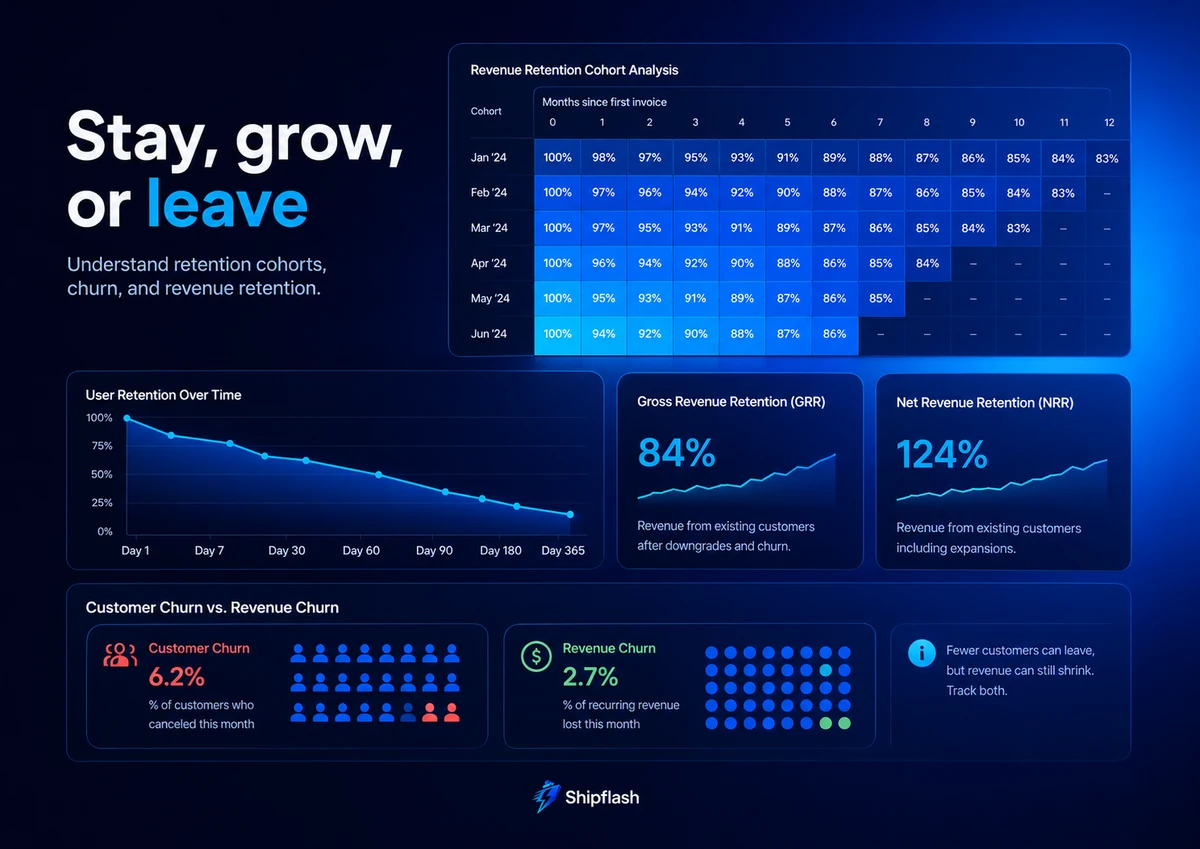
Retention measures whether a defined group continues receiving value after a starting event.
A total active-user chart cannot answer that question because it mixes customers from different acquisition periods. New signups can hide the disappearance of earlier customers.
Cohort retention starts with a group that became eligible during the same period, then checks what percentage remains active in later intervals.
Period-N retention =
  Cohort members active in period N
  ÷ Cohort members eligible at the start
The definition of “active” matters as much as the formula. Opening a page may not represent retained value. Completing a core workflow usually provides a stronger signal.
Product, Customer, and Revenue Retention Are Different
| Metric | Numerator | Denominator | What it reveals |
|---|---|---|---|
| Product retention | Accounts still completing the retained action | Original activated cohort | Continued product value |
| Customer retention | Paying accounts that remain customers | Paying accounts at period start | Logo preservation |
| Gross revenue retention | Starting MRR minus contraction and churn | Starting MRR | Revenue preserved before expansion |
| Net revenue retention | Starting MRR plus expansion and reactivation minus losses | Starting MRR | Revenue change from the existing base |
The common revenue formulas are:
GRR =
  (Starting MRR - Contraction MRR - Churned MRR)
  ÷ Starting MRR

NRR =
  (
    Starting MRR
    + Expansion MRR
    + Reactivation MRR
    - Contraction MRR
    - Churned MRR
  )
  ÷ Starting MRR
New-customer MRR is excluded from GRR and NRR because these metrics evaluate the customers who already existed at the start of the period.
A Simple Product-Retention Query
Assume product_events contains one canonical retained event per account and occurrence.
with first_value as (
  select
    account_id,
    date_trunc('month', min(occurred_at))::date as cohort_month
  from product_events
  where event_name = 'core_value_completed'
  group by account_id
),
activity as (
  select distinct
    account_id,
    date_trunc('month', occurred_at)::date as activity_month
  from product_events
  where event_name = 'core_value_completed'
),
cohort_activity as (
  select
    f.account_id,
    f.cohort_month,
    a.activity_month,
    (
      extract(year from age(a.activity_month, f.cohort_month)) * 12
      + extract(month from age(a.activity_month, f.cohort_month))
    )::int as month_number
  from first_value f
  join activity a using (account_id)
  where a.activity_month >= f.cohort_month
)
select
  cohort_month,
  month_number,
  count(distinct account_id) as retained_accounts
from cohort_activity
group by cohort_month, month_number
order by cohort_month, month_number;
The query still needs a cohort-size denominator and a decision about reactivation, deleted accounts, internal users, bots, imported history, and incomplete current periods.
Never compare a completed month with a current partial month without making that difference visible.
Churn Needs a Timestamp and a Denominator
Churn is not one event.
A customer may click cancel on August 4, retain paid access until August 31, fail to renew on September 1, and lose access after a seven-day recovery period.
Which date is churn?
That depends on the metric.
| Event | Suitable use |
|---|---|
| Cancellation requested | Cancellation intent and save-flow analysis |
| Subscription scheduled to end | Forecasting expected churn |
| Current period ended | Commercial subscription ending |
| MRR became zero | Revenue churn |
| Entitlement ended | Product-access loss |
| Core activity stopped | Behavioral churn |
Store these transitions separately. Do not overwrite one canceled_at field until it means five different things.
Customer Churn and Revenue Churn
Customer churn counts lost customers. Revenue churn counts lost recurring value.
Customer churn rate =
  Customers lost from the starting cohort
  ÷ Customers at the start of the period
Gross revenue churn rate =
  (Churned MRR + Contraction MRR)
  ÷ Starting MRR
Net revenue churn rate =
  (
    Churned MRR
    + Contraction MRR
    - Expansion MRR
    - Reactivation MRR
  )
  ÷ Starting MRR
A SaaS can lose one large customer and report low logo churn but severe revenue churn. It can also lose several small customers while expansion from larger accounts keeps net revenue churn low.
Monitor both. They answer different operational questions.
Separate Voluntary and Involuntary Churn
Voluntary churn occurs when a customer intentionally leaves.
Involuntary churn results from failed payments, expired cards, authentication requirements, or other collection problems.
Combining them hides the action the team should take. Voluntary churn may require product, pricing, positioning, or customer-success improvements. Involuntary churn may require retries, payment updates, recovery communication, and billing operations.
The billing system should classify the cause where evidence permits, while preserving an unknown state instead of inventing certainty.
Connect Billing and Product Analytics With a Stable Identity Model
Billing tools know customers, subscriptions, invoices, and transactions.
Product analytics tools know users, sessions, events, and properties.
A founder dashboard becomes useful when those domains can be connected without collapsing them into one unreliable identifier.
A practical identity model may include:
Anonymous visitor
      ↓ identify
Authenticated user
      ↓ belongs to
Workspace or account
      ↓ linked to
Billing customer
      ↓ owns
Subscription, purchase, or entitlement
Every important product event should include the smallest necessary set of stable identifiers.
{
  "event_id": "evt_01JXYZ...",
  "event_name": "project_published",
  "event_version": 1,
  "occurred_at": "2026-08-06T08:15:00Z",
  "user_id": "usr_123",
  "account_id": "acc_456",
  "session_id": "ses_789",
  "properties": {
    "project_id": "prj_321",
    "source": "dashboard",
    "is_first_publish": true
  }
}
Do not place email addresses, full names, secrets, access tokens, billing payloads, or unrestricted user-generated content into every analytics event.
Create an Event Tracking Plan
An event tracking plan documents what is collected, where it fires, why it exists, which properties are required, and which metric consumes it.
Twilio Segment describes a tracking plan as a shared source of truth for event names, properties, collection locations, and business purposes. Its tracking plan guide also recommends tracking events that answer specific customer and business questions rather than collecting everything indiscriminately.
A compact event dictionary might look like this:
| Event | Fires when | Required properties | Used by |
|---|---|---|---|
| account_created | Server commits account creation | account_id, source | Signup cohorts |
| project_published | Publish completes successfully | account_id, project_id | Activation |
| subscription_activated | Verified billing state becomes active | account_id, catalog_key | Paid conversion |
| core_value_completed | Customer receives the main outcome | account_id, workflow_type | Retention |
| subscription_ended | Effective recurring access ends | account_id, reason | Churn |
Capture business-critical events at the server or durable domain boundary when possible. A client click can prove intent, but it may not prove that the operation succeeded.
Calculate Metrics in the Database, Not in the Dashboard Component
The browser should render the answer, not invent it.
A reliable reporting flow looks like this:
Payment-provider events ─┐
                         ├─> Normalized domain records
Product events ──────────┘            ↓
                              Immutable movements
                                      ↓
                          Daily or monthly snapshots
                                      ↓
                         Database reporting functions
                                      ↓
                              Dashboard API
                                      ↓
                              Charts and tables
Database-side aggregation provides one shared definition, reduces unnecessary data transfer, and avoids recalculating the company’s full history whenever someone opens the dashboard.
PostgreSQL window functions are useful for comparisons such as period-over-period movement, running totals, rankings, and lagged values without discarding row-level context. The official PostgreSQL window-function documentation explains functions such as lag, lead, and partitioned aggregates.
For heavier historical reports, a materialized view can persist calculated results and refresh them on a controlled schedule.
create materialized view monthly_saas_metrics as
select
  metric_month,
  sum(ending_mrr_cents) as ending_mrr_cents,
  sum(new_mrr_cents) as new_mrr_cents,
  sum(expansion_mrr_cents) as expansion_mrr_cents,
  sum(contraction_mrr_cents) as contraction_mrr_cents,
  sum(churned_mrr_cents) as churned_mrr_cents,
  sum(reactivation_mrr_cents) as reactivation_mrr_cents
from account_monthly_metrics
group by metric_month;
PostgreSQL materialized views store query results in a table-like form and can be refreshed from their saved query. They can improve historical reporting performance when slight data staleness is acceptable. Review the official materialized-view documentation before choosing a refresh strategy.
Do not introduce materialized views before ordinary indexed queries become a measurable problem. The goal is trustworthy analytics, not a needlessly complex warehouse.
Design a Founder Dashboard Around Decisions
A founder dashboard does not need thirty charts.
It needs enough information to explain what changed, why it changed, and where the team should investigate.
A useful initial layout could contain:
| Area | Metrics | Decision supported |
|---|---|---|
| Revenue state | Ending MRR, net new MRR, cash collected, one-time revenue | Is the business growing, and how? |
| MRR movements | New, expansion, contraction, churn, reactivation | Which revenue motion changed? |
| Acquisition quality | Eligible signups, activation rate, paid conversion | Are new accounts reaching value? |
| Retention | Cohort retention, GRR, NRR | Are customers and revenue staying? |
| Churn | Logo churn, gross revenue churn, voluntary and involuntary churn | What is being lost and why? |
| Data health | Last refresh, unreconciled records, unknown mappings | Can the numbers be trusted? |
Every summary card should allow investigation.
Clicking MRR should expose the underlying accounts and movements. Clicking churn should show which accounts left, their recurring value, plan, cancellation timing, and reason where available.
A dashboard without drill-downs often creates more arguments than clarity.
Analytics and operational monitoring should also remain separate. Product and business analytics answer questions about customer behavior and commercial outcomes. Logs, traces, errors, and alerts answer whether the system is healthy. Shipflash’s Next.js and Supabase observability guide covers the operational side of that boundary.
A Worked SaaS Metrics Example
Assume the company starts August with $10,000 MRR.
During the month:
| Movement | Amount |
|---|---|
| New MRR | +$800 |
| Expansion MRR | +$300 |
| Reactivation MRR | +$100 |
| Contraction MRR | −$200 |
| Churned MRR | −$500 |
Ending MRR is:
$10,000 + $800 + $300 + $100 - $200 - $500
= $10,500
Net new MRR is:
$800 + $300 + $100 - $200 - $500
= $500
Gross revenue retention is:
($10,000 - $200 - $500) ÷ $10,000
= 93%
Net revenue retention is:
($10,000 + $300 + $100 - $200 - $500) ÷ $10,000
= 97%
Gross revenue churn is:
($200 + $500) ÷ $10,000
= 7%
Net revenue churn is:
($200 + $500 - $300 - $100) ÷ $10,000
= 3%
Now assume the company also collected $4,000 from annual plans and $1,500 from lifetime purchases during August.
Cash collection may be much higher than $10,500, but the annual invoices contribute only their monthly normalized values to MRR. The lifetime purchases contribute no MRR.
Both cash and MRR are useful. Combining them produces a number that answers neither question correctly.
Activation and Retention in the Same Example
Suppose 80 eligible accounts sign up during August.
Twenty-eight complete the activation condition within 14 days:
Activation rate = 28 ÷ 80 = 35%
After 30 days, 16 of those activated accounts complete the retained-value event again:
Activated-account retention = 16 ÷ 28 = 57.1%
You should also compare this with the retention of accounts that did not activate. A strong activation definition should separate customers who are more likely to remain from those who are not.
If both groups retain at nearly the same rate, the activation event may be convenient to track but weak as a predictor of value.
Test Analytics Like Production Code
Analytics errors can survive for months because the dashboard still renders.
Treat metric queries, event transformations, and snapshots as testable product behavior.
At minimum, enforce three classes of checks:
- Reconciliation: Ending MRR must equal starting MRR plus the period’s movement total.
- Integrity: One source billing event must not generate the same movement twice.
- Definition: Fixtures for trials, discounts, annual plans, refunds, cancellations, and reactivations must produce the documented result.
A useful invariant test is:
select
  snapshot_month,
  ending_mrr_cents
    - starting_mrr_cents
    - net_mrr_change_cents as unexplained_difference_cents
from monthly_mrr_reconciliation
where
  ending_mrr_cents
    <> starting_mrr_cents + net_mrr_change_cents;
A valid report should return no unexplained rows, except for explicitly modeled adjustments such as foreign-exchange movements or approved historical corrections.
The broader approach to unit, integration, database, contract, and end-to-end coverage is explained in Shipflash’s Next.js, Supabase, Vitest, and Playwright testing strategy.
Common SaaS Analytics Mistakes
| Mistake | Why it fails | Better approach |
|---|---|---|
| Treating cash as MRR | Annual and one-time payments inflate recurring value | Separate cash, recurring, and one-time revenue |
| Calculating history from current subscription state | Past upgrades and churn timing disappear | Store immutable MRR movements |
| Counting lifetime purchases as recurring revenue | Creates artificial MRR | Report them as one-time sales |
| Measuring activation as signup | Signup does not prove value | Use an outcome correlated with retention |
| Reporting total active users as retention | New users hide older cohort losses | Use cohort-based retention |
| Counting users when accounts pay | Multiple members inflate customer totals | Define user, workspace, and billing entities |
| Churning customers on cancel-click | Paid remaining access is ignored | Distinguish request, effective end, and access end |
| Mixing partial and completed periods | Current performance appears artificially weak | Label or exclude incomplete periods |
| Recalculating metrics in React | Definitions drift across screens | Aggregate in the database |
| Changing formulas silently | Historical trends become incomparable | Version definitions and disclose restatements |
| Trusting one provider as universal truth | Provider rules may differ from product rules | Reconcile provider and internal records |
| Tracking everything | Noise grows faster than insight | Maintain a question-driven tracking plan |
A Practical Implementation Roadmap
Phase 1: Define the Business Language
Document MRR, each MRR movement, activation, retained activity, customer churn, gross revenue retention, and net revenue retention.
For every metric, specify the entity, denominator, source, timezone, inclusion rules, exclusions, owner, and definition version.
Phase 2: Build the Evidence Layer
Normalize provider records, store verified billing events, create an MRR movement ledger, establish account-level product events, and connect users, workspaces, billing customers, subscriptions, purchases, and entitlements.
Add daily or monthly snapshots only after the underlying event model is reliable.
Phase 3: Build the Decision Interface
Expose a small scorecard, movement tables, cohort analysis, plan and acquisition segments, data freshness, and drill-downs to underlying records.
Add alerts only for conditions that lead to a clear action, such as unexplained MRR drift, broken event delivery, a sudden activation decline, or increased involuntary churn.
How Shipflash Approaches SaaS Analytics
Shipflash treats analytics as part of the operating foundation of a SaaS product rather than an isolated set of charts.
A useful founder dashboard depends on the systems beneath it: structured customer records, reliable billing state, normalized product events, secure administrative access, database-side aggregation, testing, and enough operational visibility to investigate anomalies.
Shipflash provides a structured Next.js and Supabase foundation where these concerns can live together without forcing every new product to rebuild the surrounding architecture from zero.
The goal is not to prescribe one universal activation event or churn policy. Those decisions depend on the product.
The goal is to give founders and developers a maintainable place to define those decisions, implement them consistently, and evolve them without losing the history that makes the dashboard trustworthy. The broader architectural approach is covered in How to Build a Production-Ready SaaS Foundation.
Frequently Asked Questions
What Is MRR in SaaS?
Monthly recurring revenue is the normalized monthly value of active recurring customer commitments. Monthly plans usually contribute their current recurring amount, while annual plans are commonly divided by 12. One-time purchases, taxes, and non-recurring fees should be reported separately.
Should Annual Subscriptions Count Toward MRR?
Yes, when the annual payment represents recurring subscription access. Normalize the recurring contract value across 12 months rather than adding the entire annual invoice to the month in which cash was collected.
Should Lifetime Purchases Count as MRR?
No. A lifetime purchase creates one-time revenue and cash, but it does not create a recurring monthly commitment. Including lifetime sales in MRR overstates the recurring base of the business.
What Is a Good Activation Metric?
A good activation metric represents the customer receiving meaningful value within a realistic time window and predicts a later outcome such as retention or paid conversion. It should describe successful use of the product, not merely a page view or signup.
What Is the Difference Between Retention and Churn?
Retention measures the customers, activity, or recurring revenue that remains from a starting cohort. Churn measures what was lost. They are related, but the exact inverse relationship depends on whether the metric includes expansion, contraction, reactivation, and new customers.
Why Does Stripe MRR Differ From My Internal Dashboard?
The systems may use different policies for discounts, trials, past-due subscriptions, cancellation timing, usage products, multiple currencies, or customer identity. Compare the definitions and underlying accounts before assuming that one total is technically wrong.
How Often Should a SaaS Dashboard Refresh?
Operational summaries may refresh every few minutes, while historical cohort and monthly revenue reports may refresh hourly or daily. Display the last successful calculation time and avoid implying real-time precision when the source data is delayed.
Do I Need a Data Warehouse for SaaS Analytics?
Not necessarily. Many early and growing SaaS products can calculate reliable metrics with well-designed Postgres tables, indexed queries, database functions, and scheduled snapshots. Introduce a separate warehouse when data volume, source count, historical complexity, or analytical workloads create a demonstrated need.
Conclusion
A trustworthy SaaS analytics dashboard is not the product of better chart design.
It is the product of better definitions.
MRR must remain separate from cash and one-time revenue. Revenue changes should be represented as movements. Activation should describe delivered value. Retention should use stable cohorts. Churn should have a precise effective time and denominator. Billing identities must connect cleanly to product identities.
Most importantly, every important number should be traceable.
A founder should be able to move from “MRR declined by 4%” to the accounts, events, subscription transitions, and calculation version responsible for that change.
That is when a dashboard stops being decoration.
It becomes an operating system for understanding the business.